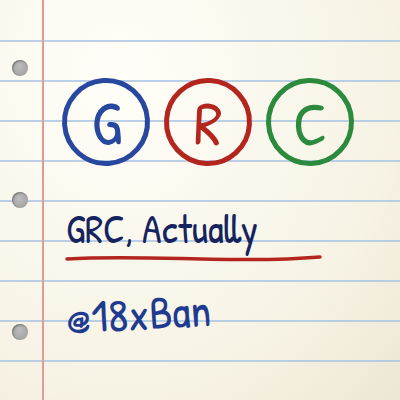
Data Flow Mapping With Trust Boundaries
Eight flows, four boundaries, and a pipeline nobody remembered writing.
@18xBan · GRC Series · Chapter 05
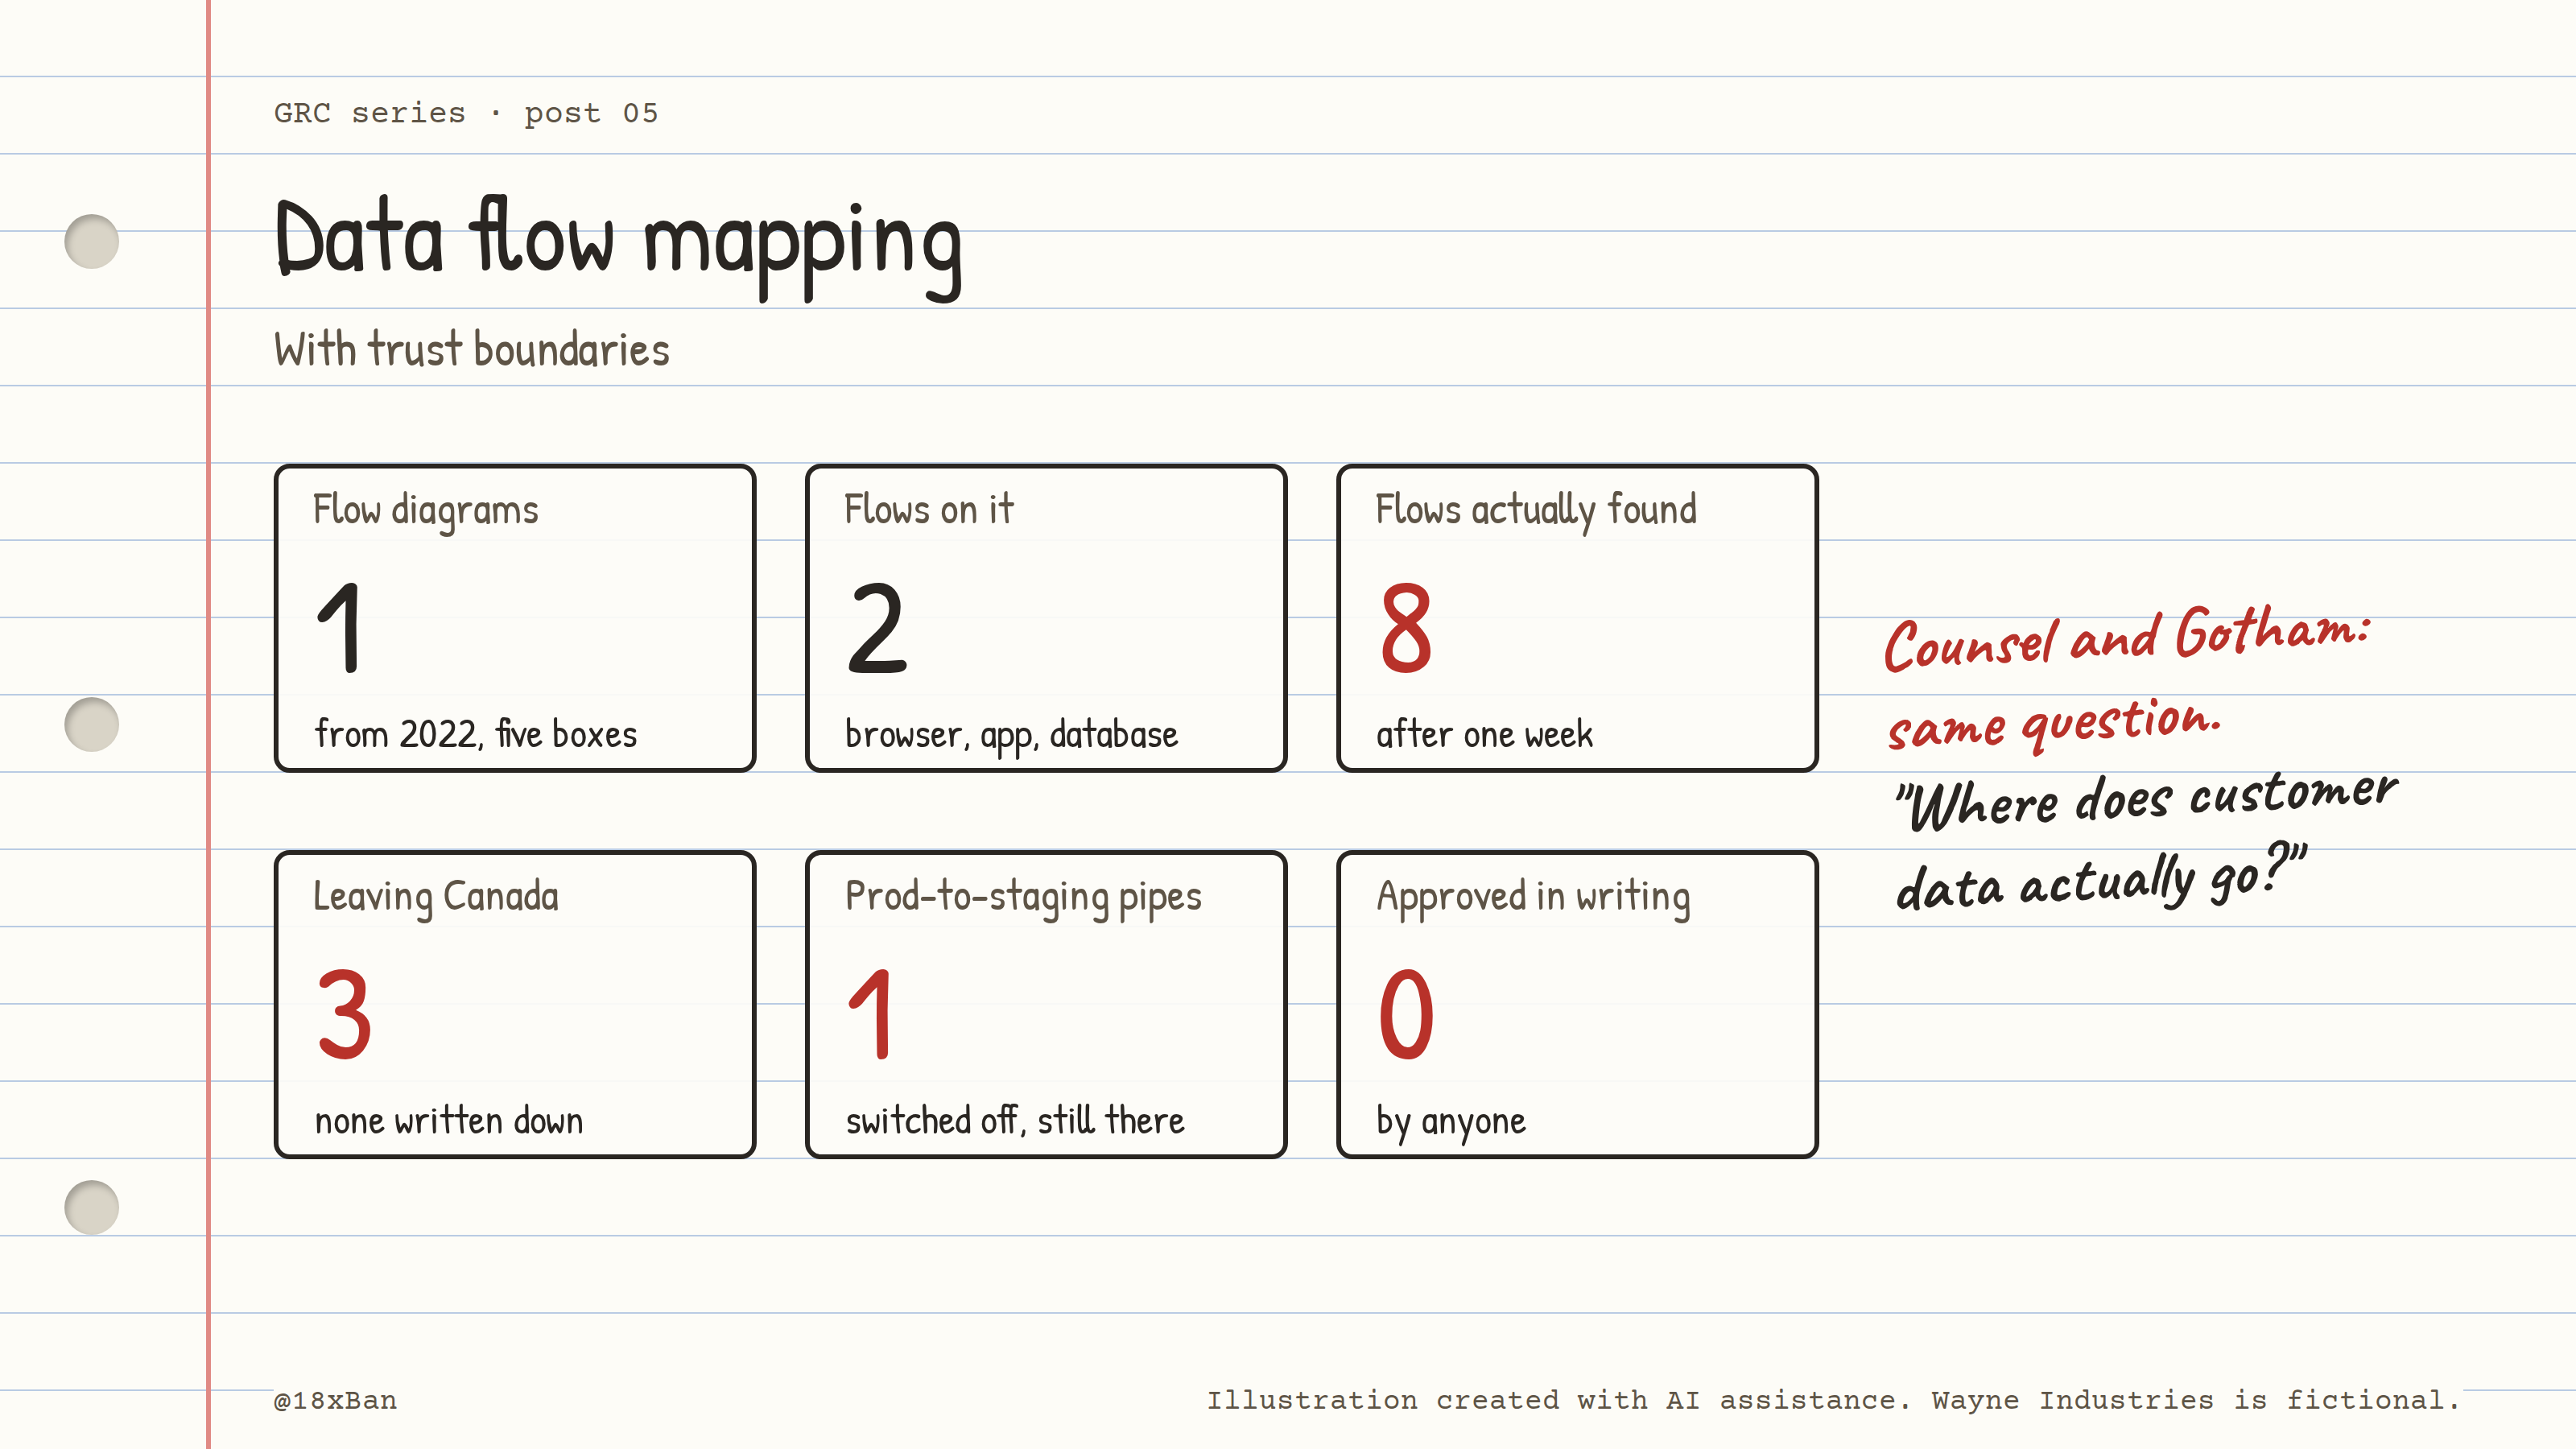
One diagram from 2022, five boxes, and no arrows leaving AWS.
Monday, 8:47 AM: "Where else has it been?"
Dan forwards an email from Wayne's outside legal counsel. It's about prod-export-2024.sql.gz, the production export still sitting (locked now) in the staging bucket.
Counsel's question is short:
Before we can advise on whether this is reportable, we need to know every place this customer data goes, and every place a copy of it could have ended up.
Ten minutes later, a second forward. Gotham Mutual's questionnaire, question 58:
Provide a data flow diagram showing where customer data is stored, processed and transmitted, including subprocessors and their locations.
Two different people, the same question: where does Wayne's customer data actually go?
You open the wiki. The only diagram is architecture-v2.png, drawn in 2022. Five boxes: Browser, Load balancer, App, Database, Backups. Neat arrows. No staging. No vendors. Nothing ever leaves AWS.
You ask Priya if that's still accurate.
Priya: Roughly. You: Does customer data go anywhere that isn't on this picture? Priya: ...define "anywhere."
That's the week.
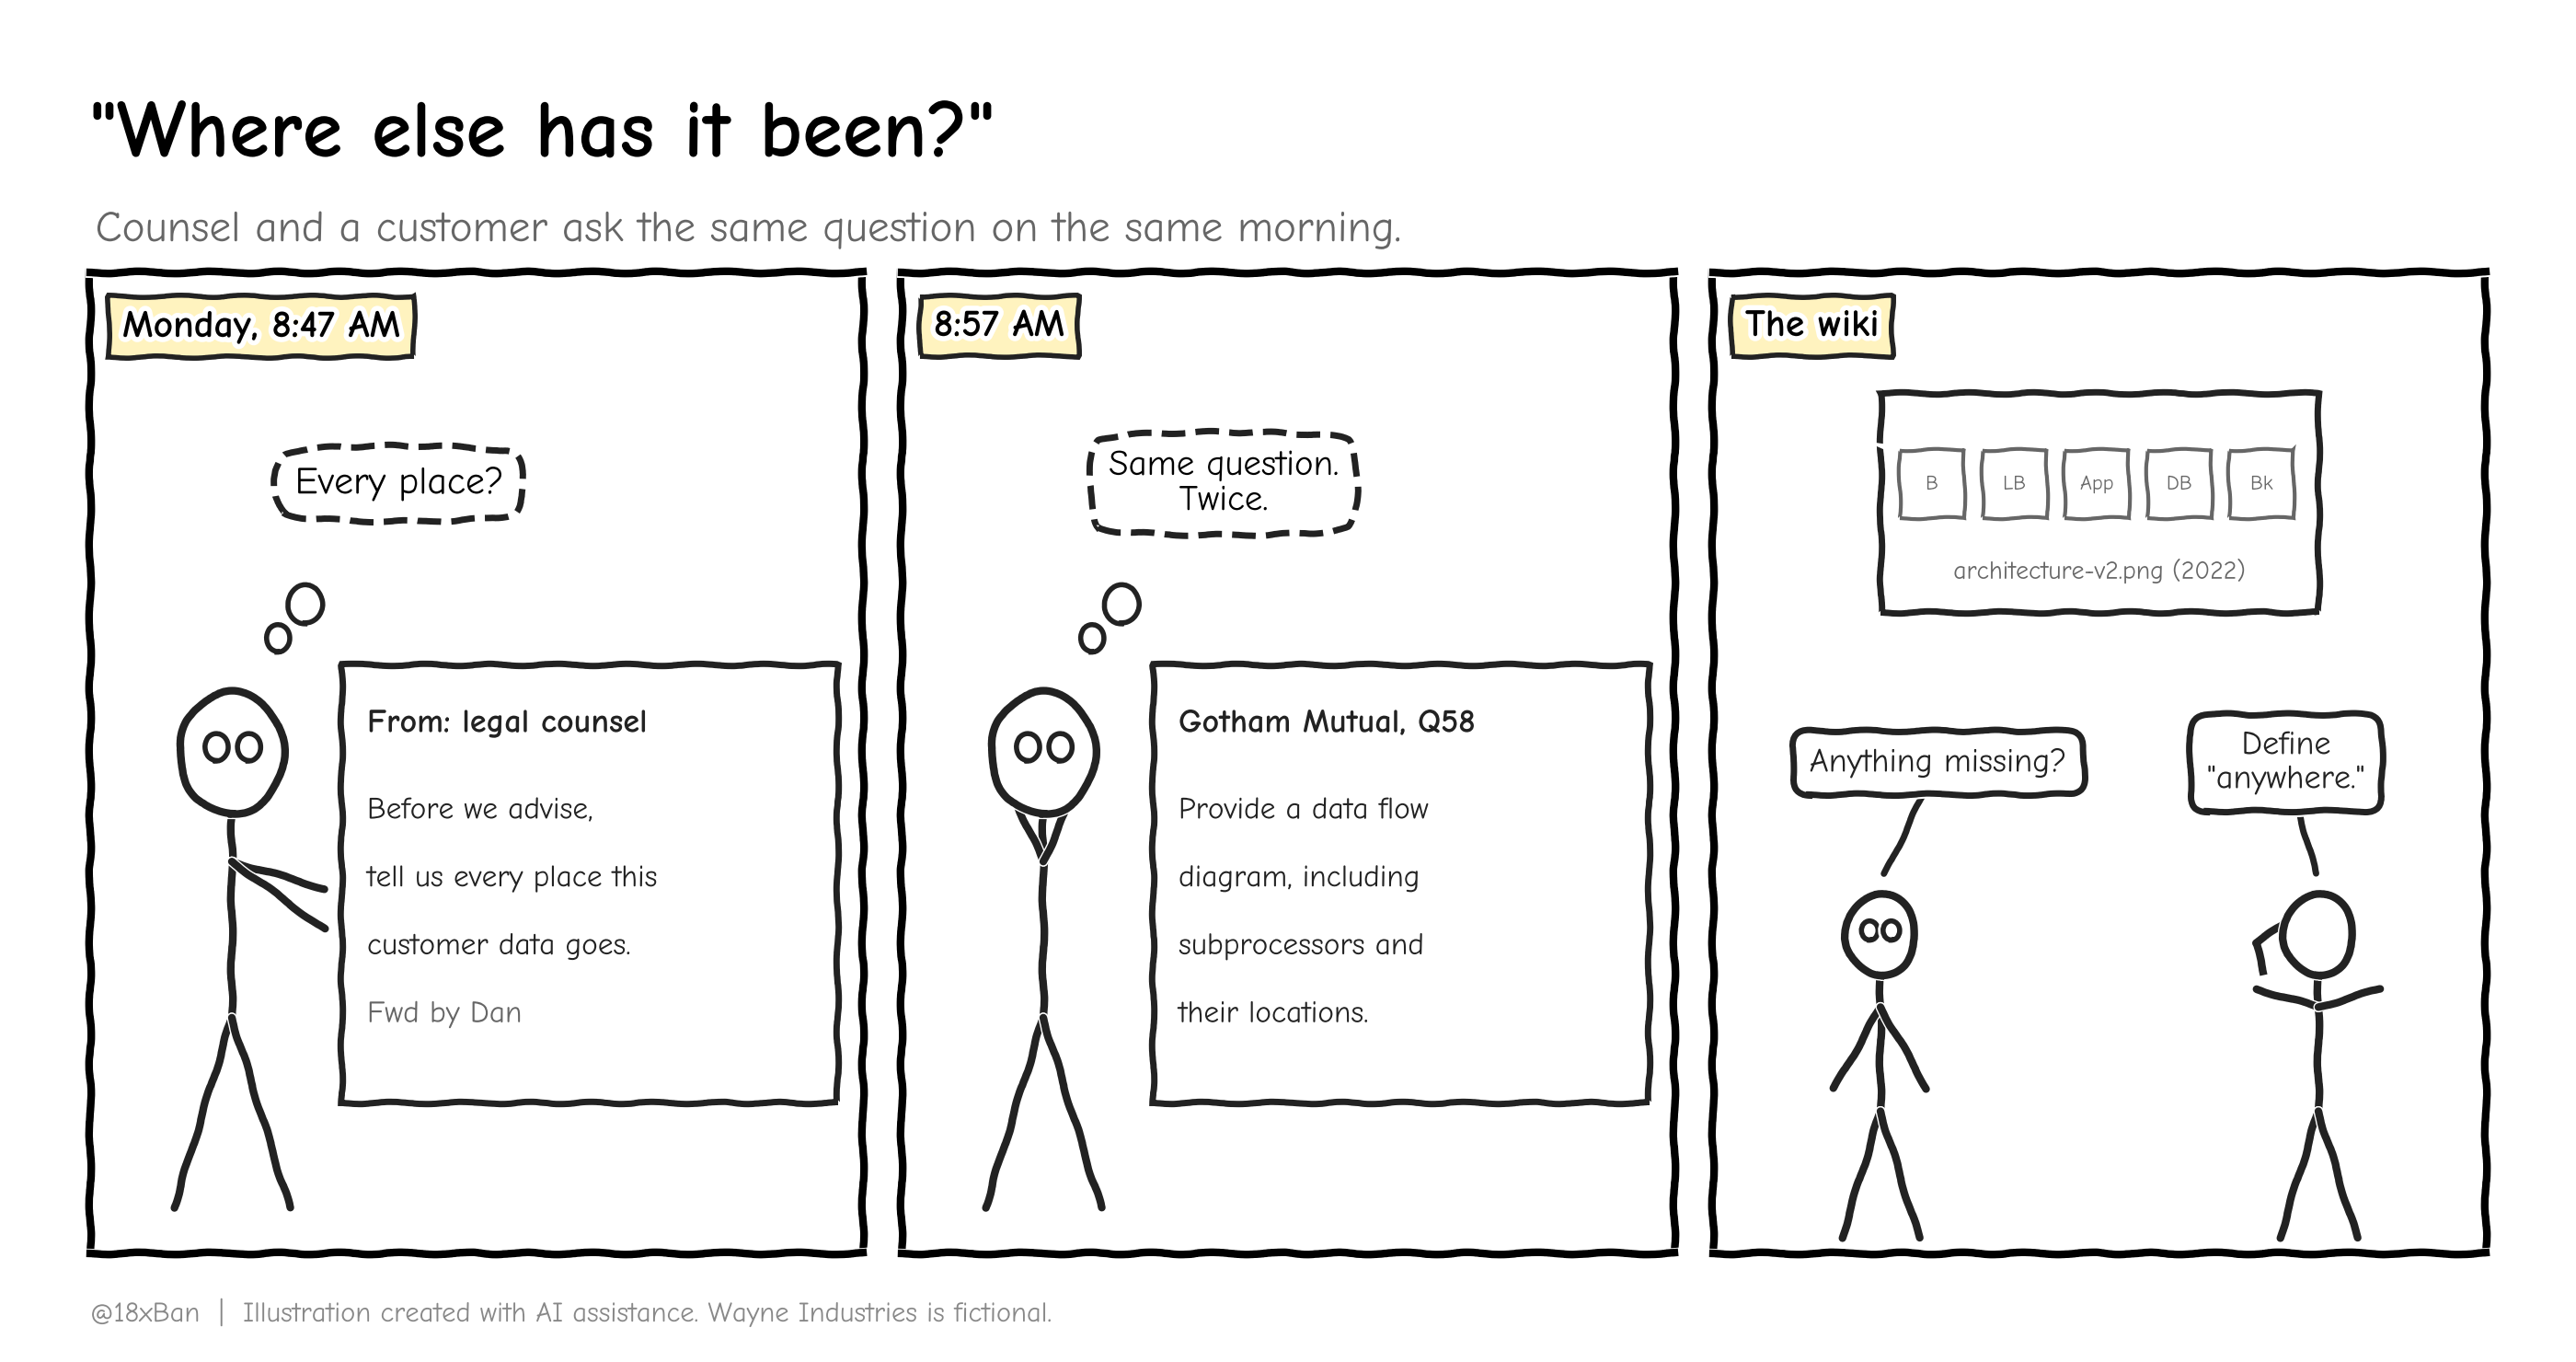
Counsel and a customer ask the same question. The wiki has five boxes.
What a data flow map actually is
A data flow diagram (DFD) shows how data moves: where it comes from, what touches it, where it's stored and where it leaves. It uses four shapes:
External entity (or actor): a person or system outside your control. A customer, a vendor.
Process: something that handles data. Your API, a background worker, a CI job.
Data store: somewhere data rests. A database, a bucket, a backup, a spreadsheet.
Data flow: an arrow showing data moving from one to another.
Then there's the fifth element, the one that makes the diagram useful for security: the trust boundary. It's a dashed line drawn wherever the level of trust changes. Internet to your network. Production to staging. Your company to a vendor. Canada to another country.
Think of an airport. Passport control and the security checkpoint are trust boundaries. Everything that crosses them gets checked: who you are, what you're carrying, whether you're allowed through. The airport is fine with people moving around. What it cares about is the crossings.
Data flows work the same way. A flow that stays inside production is one kind of risk. A flow that crosses a boundary needs answers: who approved it, is it encrypted, is there a contract, and does anyone know it exists?
And the thing that ruins airports is the same thing that ruins data flow maps: the staff door nobody put on the floor plan.
The unpopular truth: your architecture diagram is not a data flow map. An architecture diagram shows how the system is built. A data flow map shows where the data goes, including the ugly parts: the export someone ran once, the CSV in an email, the error tracker quietly collecting customer emails.
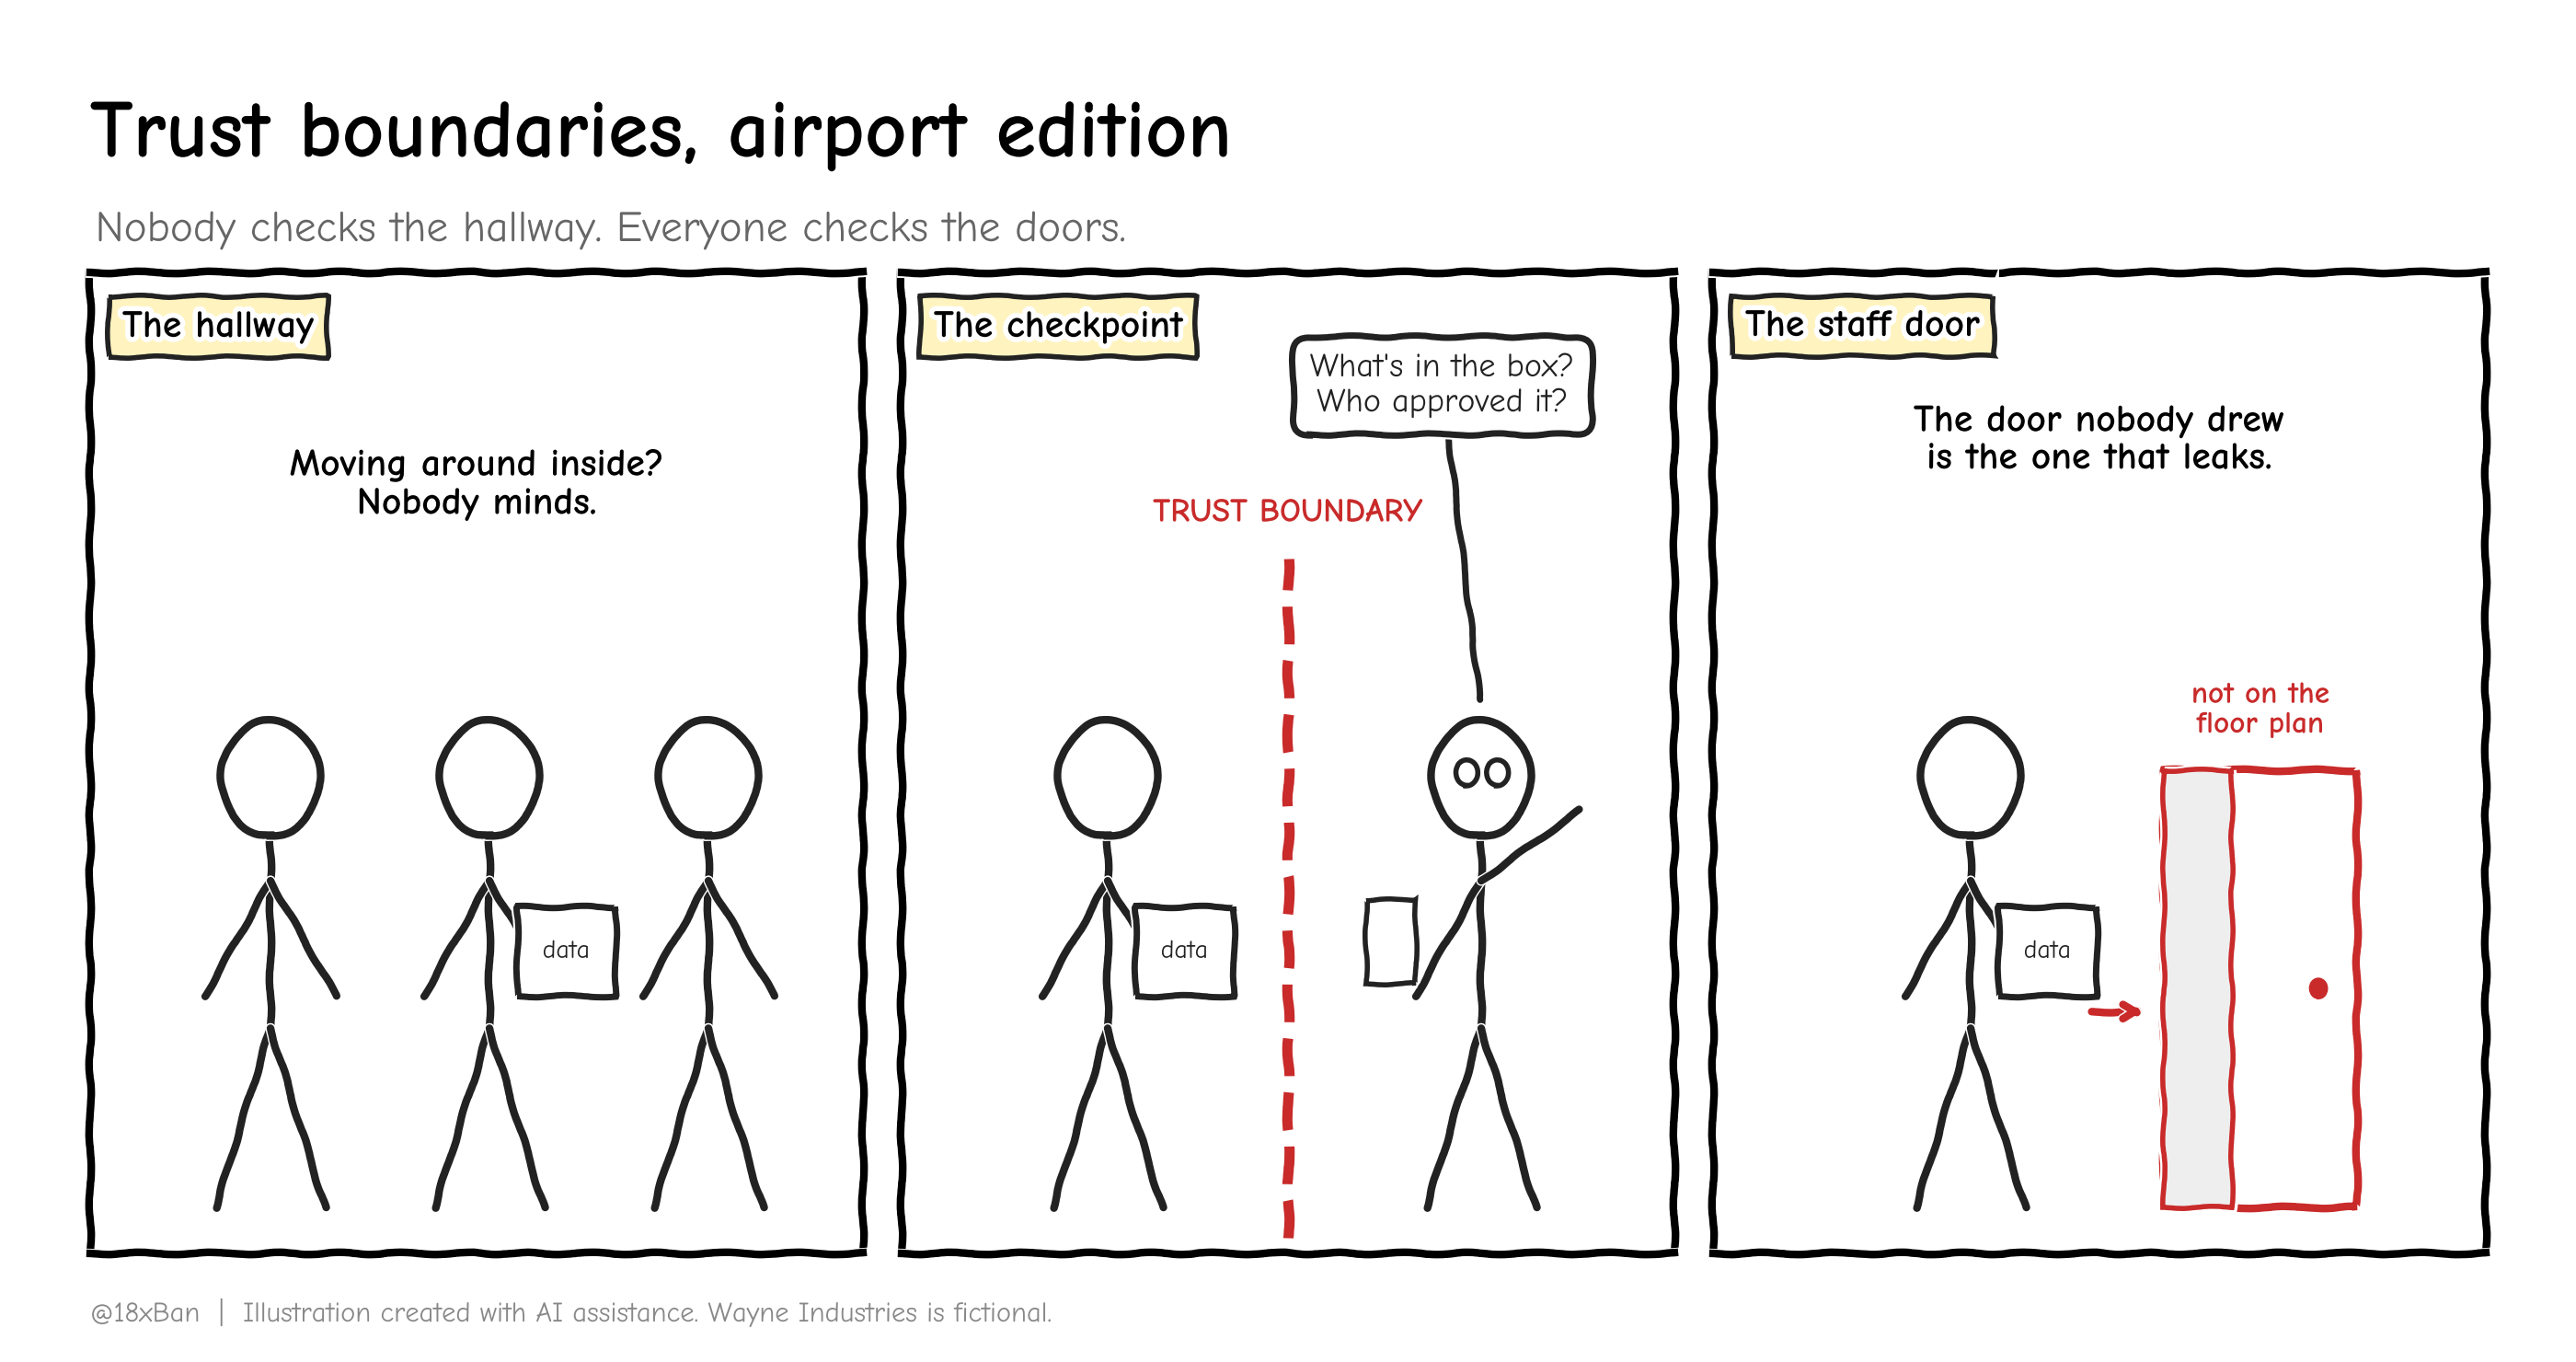
Nobody worries about the hallway. They worry about the doors.
The tool: OWASP Threat Dragon
You don't need to invent a diagram format. OWASP Threat Dragon is a free, open-source tool from the OWASP Foundation for drawing data flow diagrams with trust boundaries. It's built for threat modelling, but today you'll only use it to draw.
It runs as a desktop app (Windows, macOS, Linux) or as a web app you host yourself. Get it from the OWASP Threat Dragon project page or its GitHub releases.
https://owasp.org/projects/threat-dragon: OWASP Threat Dragon project page
https://github.com/OWASP/threat-dragon: OWASP Threat Dragon GitHub
Two things make it a good fit for a one-person security team:
The model is a JSON file. You can commit it to Git, review changes in a merge request, and query it from the command line.
Each element has security properties. A flow records whether it's encrypted and whether it crosses a public network. A store records whether it's encrypted or holds credentials. That turns a picture into something you can check.
Threat Dragon draws the map. The classification scheme from last week tells you which flows matter most. Anything carrying Restricted data gets drawn first, and gets drawn completely.
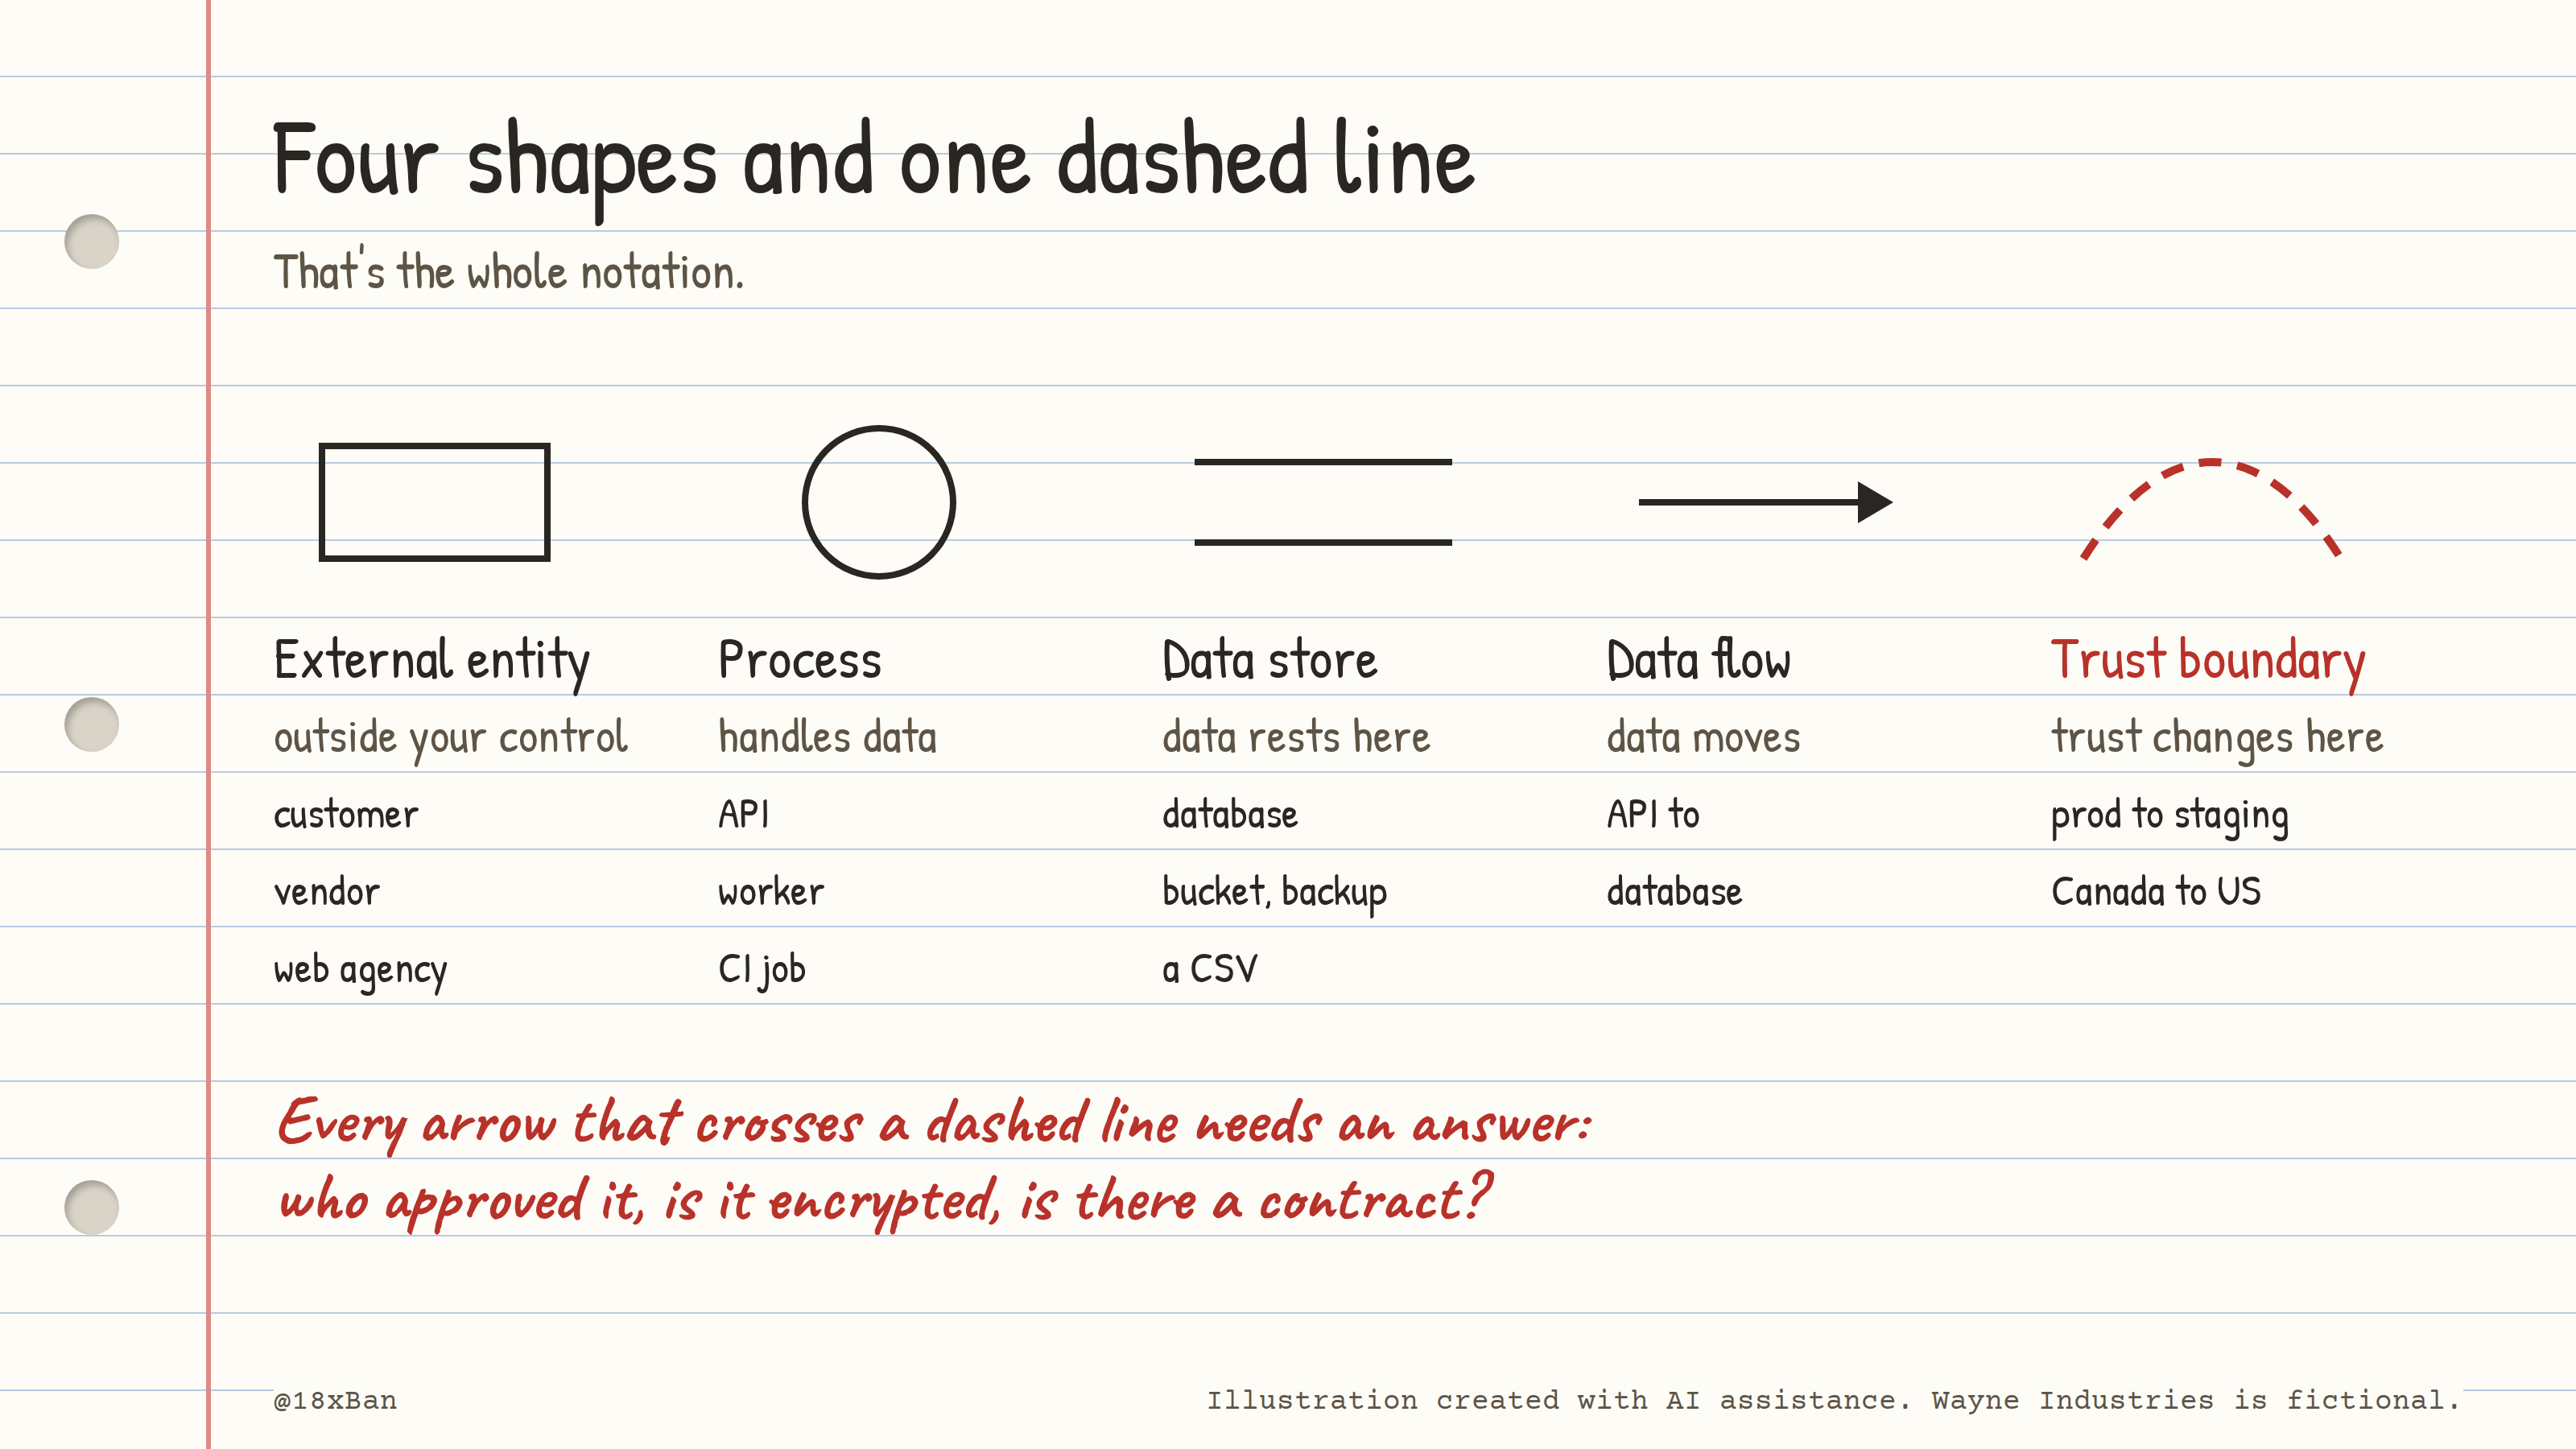
Four shapes and one dashed line. That's the whole notation.
Field by field: what Threat Dragon records
| Element | Field | What it holds | Why it matters |
|---|---|---|---|
| Any element | Name | What it is, in plain words | "F7 refresh-staging" beats "Job 3" |
| Any element | Description | Free text | Wayne records the data class and which boundary it crosses |
| Any element | Out of scope + reason | Excluded from this model, and why | Scope decisions become visible, not silent |
| Actor | Provides authentication | This entity signs users in | Marks where identity comes from |
| Process | (name, description) | Something that handles data | Every process is a place data can be copied |
| Store | Is encrypted | Data at rest is encrypted | Restricted stores should say yes |
| Store | Is a log | The store holds logs | Logs often hold personal info nobody planned for |
| Store | Stores credentials | Passwords, keys or tokens live here | Flags the stores attackers want most |
| Store | Is signed | Integrity protection on stored data | Tampering is a risk too, not just leaks |
| Flow | Protocol | How data moves: HTTPS, pg_dump, email | "Email attachment" should make you pause |
| Flow | Is encrypted | Encrypted in transit | Required for any Restricted flow |
| Flow | Is public network | Crosses the internet | Raises the bar for everything else |
| Flow | Is bidirectional | Data moves both ways | Changes who can send what to whom |
| Trust boundary | Name | Which boundary it is | Wayne numbers them TB1 to TB4 |
Wayne before
Data flow documentation: architecture-v2.png (2022), 5 boxes
Flows shown: 2 (browser to app, app to database)
Third parties shown: 0
Trust boundaries shown: 0
Countries shown: 0
Last reviewed: never
Approved by: nobody
Step 1: Watch, Read, Ask
There are three ways to find data flows, and you need all three. Each one misses things the others catch.
Watch what's connected right now.
Read the code and config for anything that sends data somewhere.
Ask the people who move data by hand.
Start at the most sensitive store and work outward. For Wayne, that's the production customer database in wayne-prod, in AWS's Canada (Central) region.
Watch: who's connected, and who could be
psql -h wayne-prod-db.xxxxxxxx.ca-central-1.rds.amazonaws.com -U postgres -d appdb -c "
SELECT usename, application_name, client_addr
FROM pg_stat_activity
WHERE datname = 'appdb' AND usename IS NOT NULL;"
   usename    | application_name | client_addr
--------------+------------------+-------------
 wayne_api    | wayne-api        | 10.20.1.15
 wayne_api    | wayne-api        | 10.20.1.38
 wayne_worker | wayne-worker     | 10.20.2.9
(3 rows)
Sample output (illustrative). Wayne Industries is fictional.
That's today's connections. It only shows what's running right now. So ask a second question: who is allowed to log in at all?
psql -h wayne-prod-db.xxxxxxxx.ca-central-1.rds.amazonaws.com -U postgres -d appdb -c "
SELECT rolname FROM pg_roles WHERE rolcanlogin ORDER BY rolname;"
   rolname
--------------
 ci_refresh
 postgres
 wayne_api
 wayne_worker
(4 rows)
Sample output (illustrative). Wayne Industries is fictional.
ci_refresh isn't connected. It can log in anyway. Nobody on the 2022 diagram is called that.
Read: find what uses it
Search the code for the role name and the staging bucket:
cd ~/src/wayne-app
grep -rn -e "ci_refresh" -e "wayne-staging-data" --include="*.yml" --include="*.sh" .
./.gitlab-ci.yml:88:  refresh_staging:
./.gitlab-ci.yml:93:    - ./scripts/refresh-staging.sh
./scripts/refresh-staging.sh:9:PGUSER=ci_refresh
./scripts/refresh-staging.sh:14:aws s3 cp prod-export-$(date +%Y).sql.gz s3://wayne-staging-data/
./scripts/refresh-staging.sh:17:gunzip -c prod-export-$(date +%Y).sql.gz | psql "$STAGING_DB_URL"
Sample output (illustrative). Wayne Industries is fictional.
There it is. A CI job that dumps production, uploads the dump to the staging bucket, and restores it into the staging database. That's where prod-export-2024.sql.gz came from. And it means there's a second copy nobody had counted: the staging database itself.
Is the job still scheduled? GitLab's API will tell you:
curl --silent --header "PRIVATE-TOKEN: $GITLAB_TOKEN" \
  "https://gitlab.wayne-industries.example/api/v4/projects/42/pipeline_schedules"
[
  {
    "id": 3,
    "description": "refresh staging from prod",
    "ref": "refs/heads/main",
    "cron": "0 2 * * 0",
    "cron_timezone": "America/Toronto",
    "next_run_at": "2025-01-05T07:00:00.000Z",
    "active": false,
    "created_at": "2024-03-11T15:02:41.000Z",
    "updated_at": "2024-03-18T09:12:05.000Z",
    "owner": { "name": "Priya Nair", "username": "priya.nair" }
  }
]
Sample output (illustrative). Wayne Industries is fictional.
Inactive. Priya confirms the story: she set it up in March 2024, it ran once, the staging restore broke half the test suite, and she switched it off. The job, the script and the ci_refresh credential stayed.
Priya: It's off. It's not a flow anymore. You: One click turns it back on. It's a flow.
A dormant flow still goes on the map. What matters is what can happen, not just what happened last week.
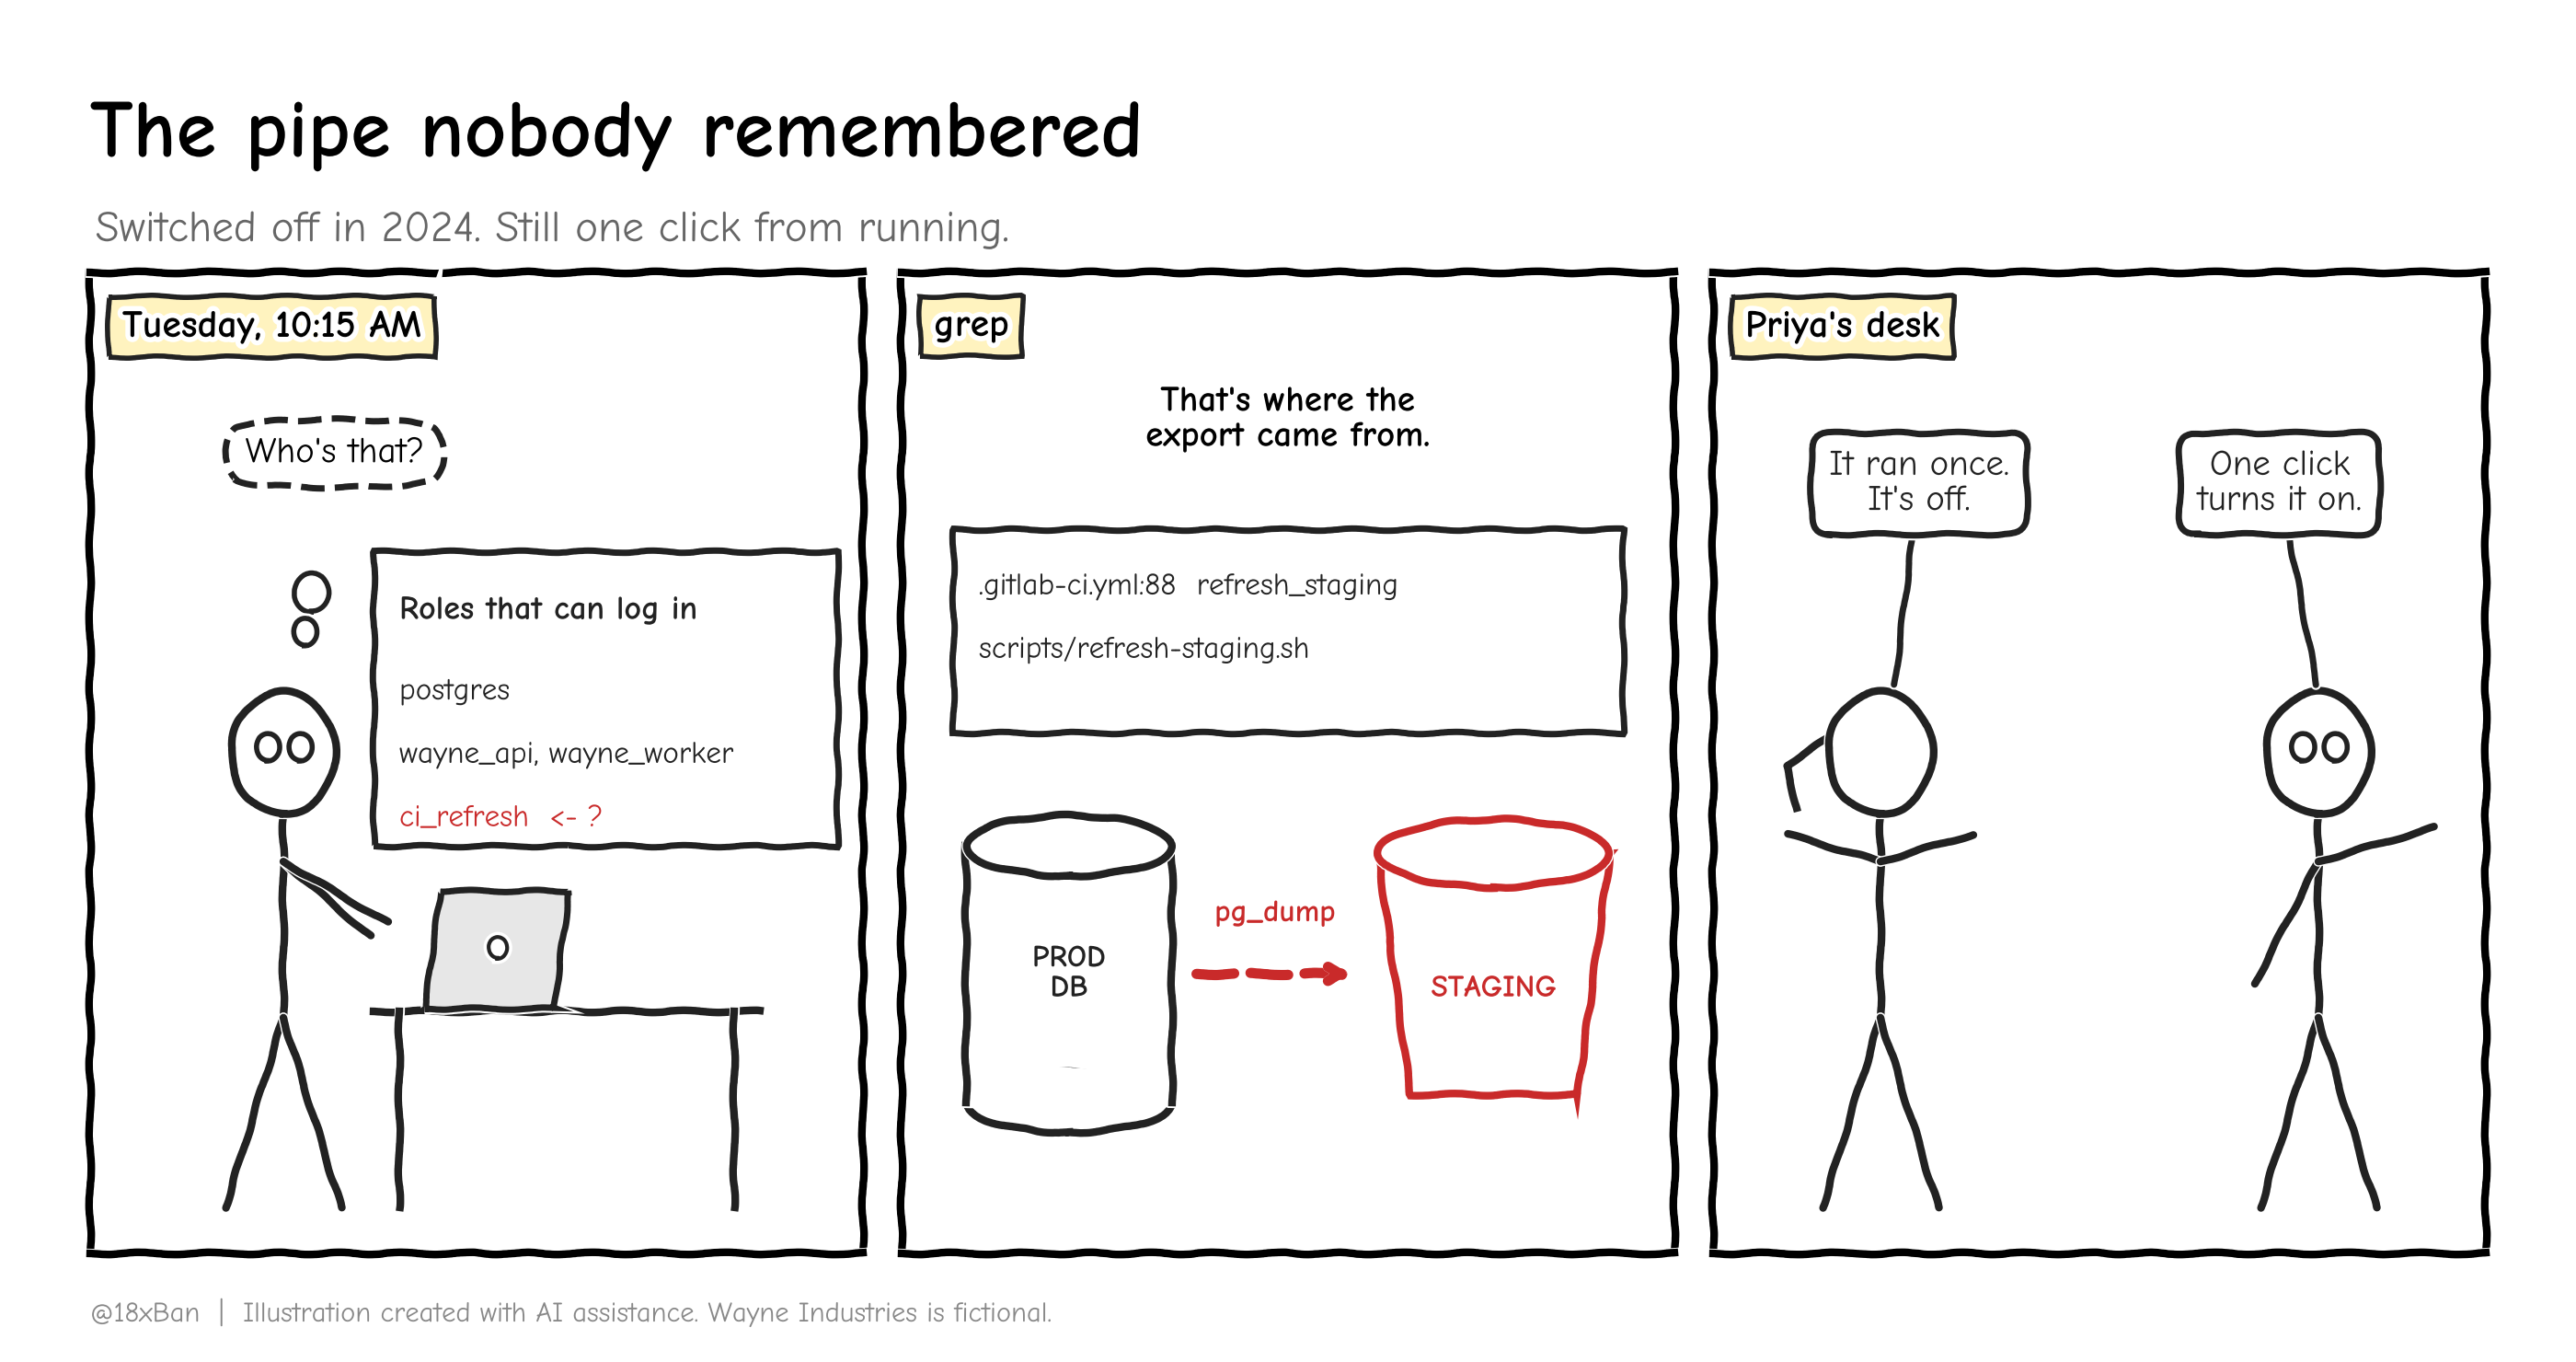
Switched off in 2024. Still one click from running.
Next, search for anything that sends data out of Wayne:
grep -rhoE "https://[a-zA-Z0-9.-]+\.[a-z]{2,}" config/ app/ | sort | uniq -c | sort -rn
     14 https://api.mailrelay.example
      9 https://ingest.tracelight.example
      6 https://api.deskline.example
      3 https://docs.wayne-industries.example
Sample output (illustrative). Wayne Industries is fictional.
Three vendors receive data straight from the app: a transactional email service (MailRelay), an error tracker (Tracelight) and the support desk (Deskline). They're 3 of Wayne's 12 unreviewed vendors. Their own documentation says MailRelay and Tracelight process data in the United States. Deskline hosts in Canada.
The error tracker deserves a closer look. Stack traces often include whatever was in memory when something broke. You open a recent Tracelight event and find a customer's email address in the request body. Nobody chose to send customer data to Tracelight. It just happens every time the app throws an error.
Read the cloud, too
Code isn't the only place flows hide. Infrastructure settings move data too:
aws rds describe-db-instance-automated-backups \
  --region us-east-1 \
  --profile wayne-prod \
  --query 'DBInstanceAutomatedBackups[].[DBInstanceIdentifier,Region,Status,Encrypted]' \
  --output table
-------------------------------------------------------------
|              DescribeDBInstanceAutomatedBackups           |
+-------------------+----------------+--------------+-------+
|  wayne-prod-db    |  ca-central-1  |  replicating |  True |
+-------------------+----------------+--------------+-------+
Sample output (llustrative). Wayne Industries is fictional.
Run in the us-east-1 region, this shows backups of wayne-prod-db, which lives in ca-central-1, being copied to the United States. Dan turned it on in 2023 for disaster recovery. It's a sensible setting. It's also customer data leaving Canada, and it isn't written down anywhere.
Ask: the flows no tool can find
Then you talk to people. The question that works best isn't "what systems do you use?" It's: "When did you last send customer information to anyone?"
Maya answers on Wednesday without looking up from her laptop:
Maya: Every quarter, marketing emails the web agency a list of customer contacts for the newsletter. You: As an attachment? Maya: A spreadsheet. Names, emails, company.
No code, no API, no log in AWS. A CSV, in an email, to an outside agency that runs its own AWS account (marketing-test) and has never had a security review.
The unpopular truth: the riskiest flows usually aren't in your code. They're in people's habits. Code search will never find a spreadsheet someone emails every quarter. You have to ask, and you have to ask the question in their words, not yours.
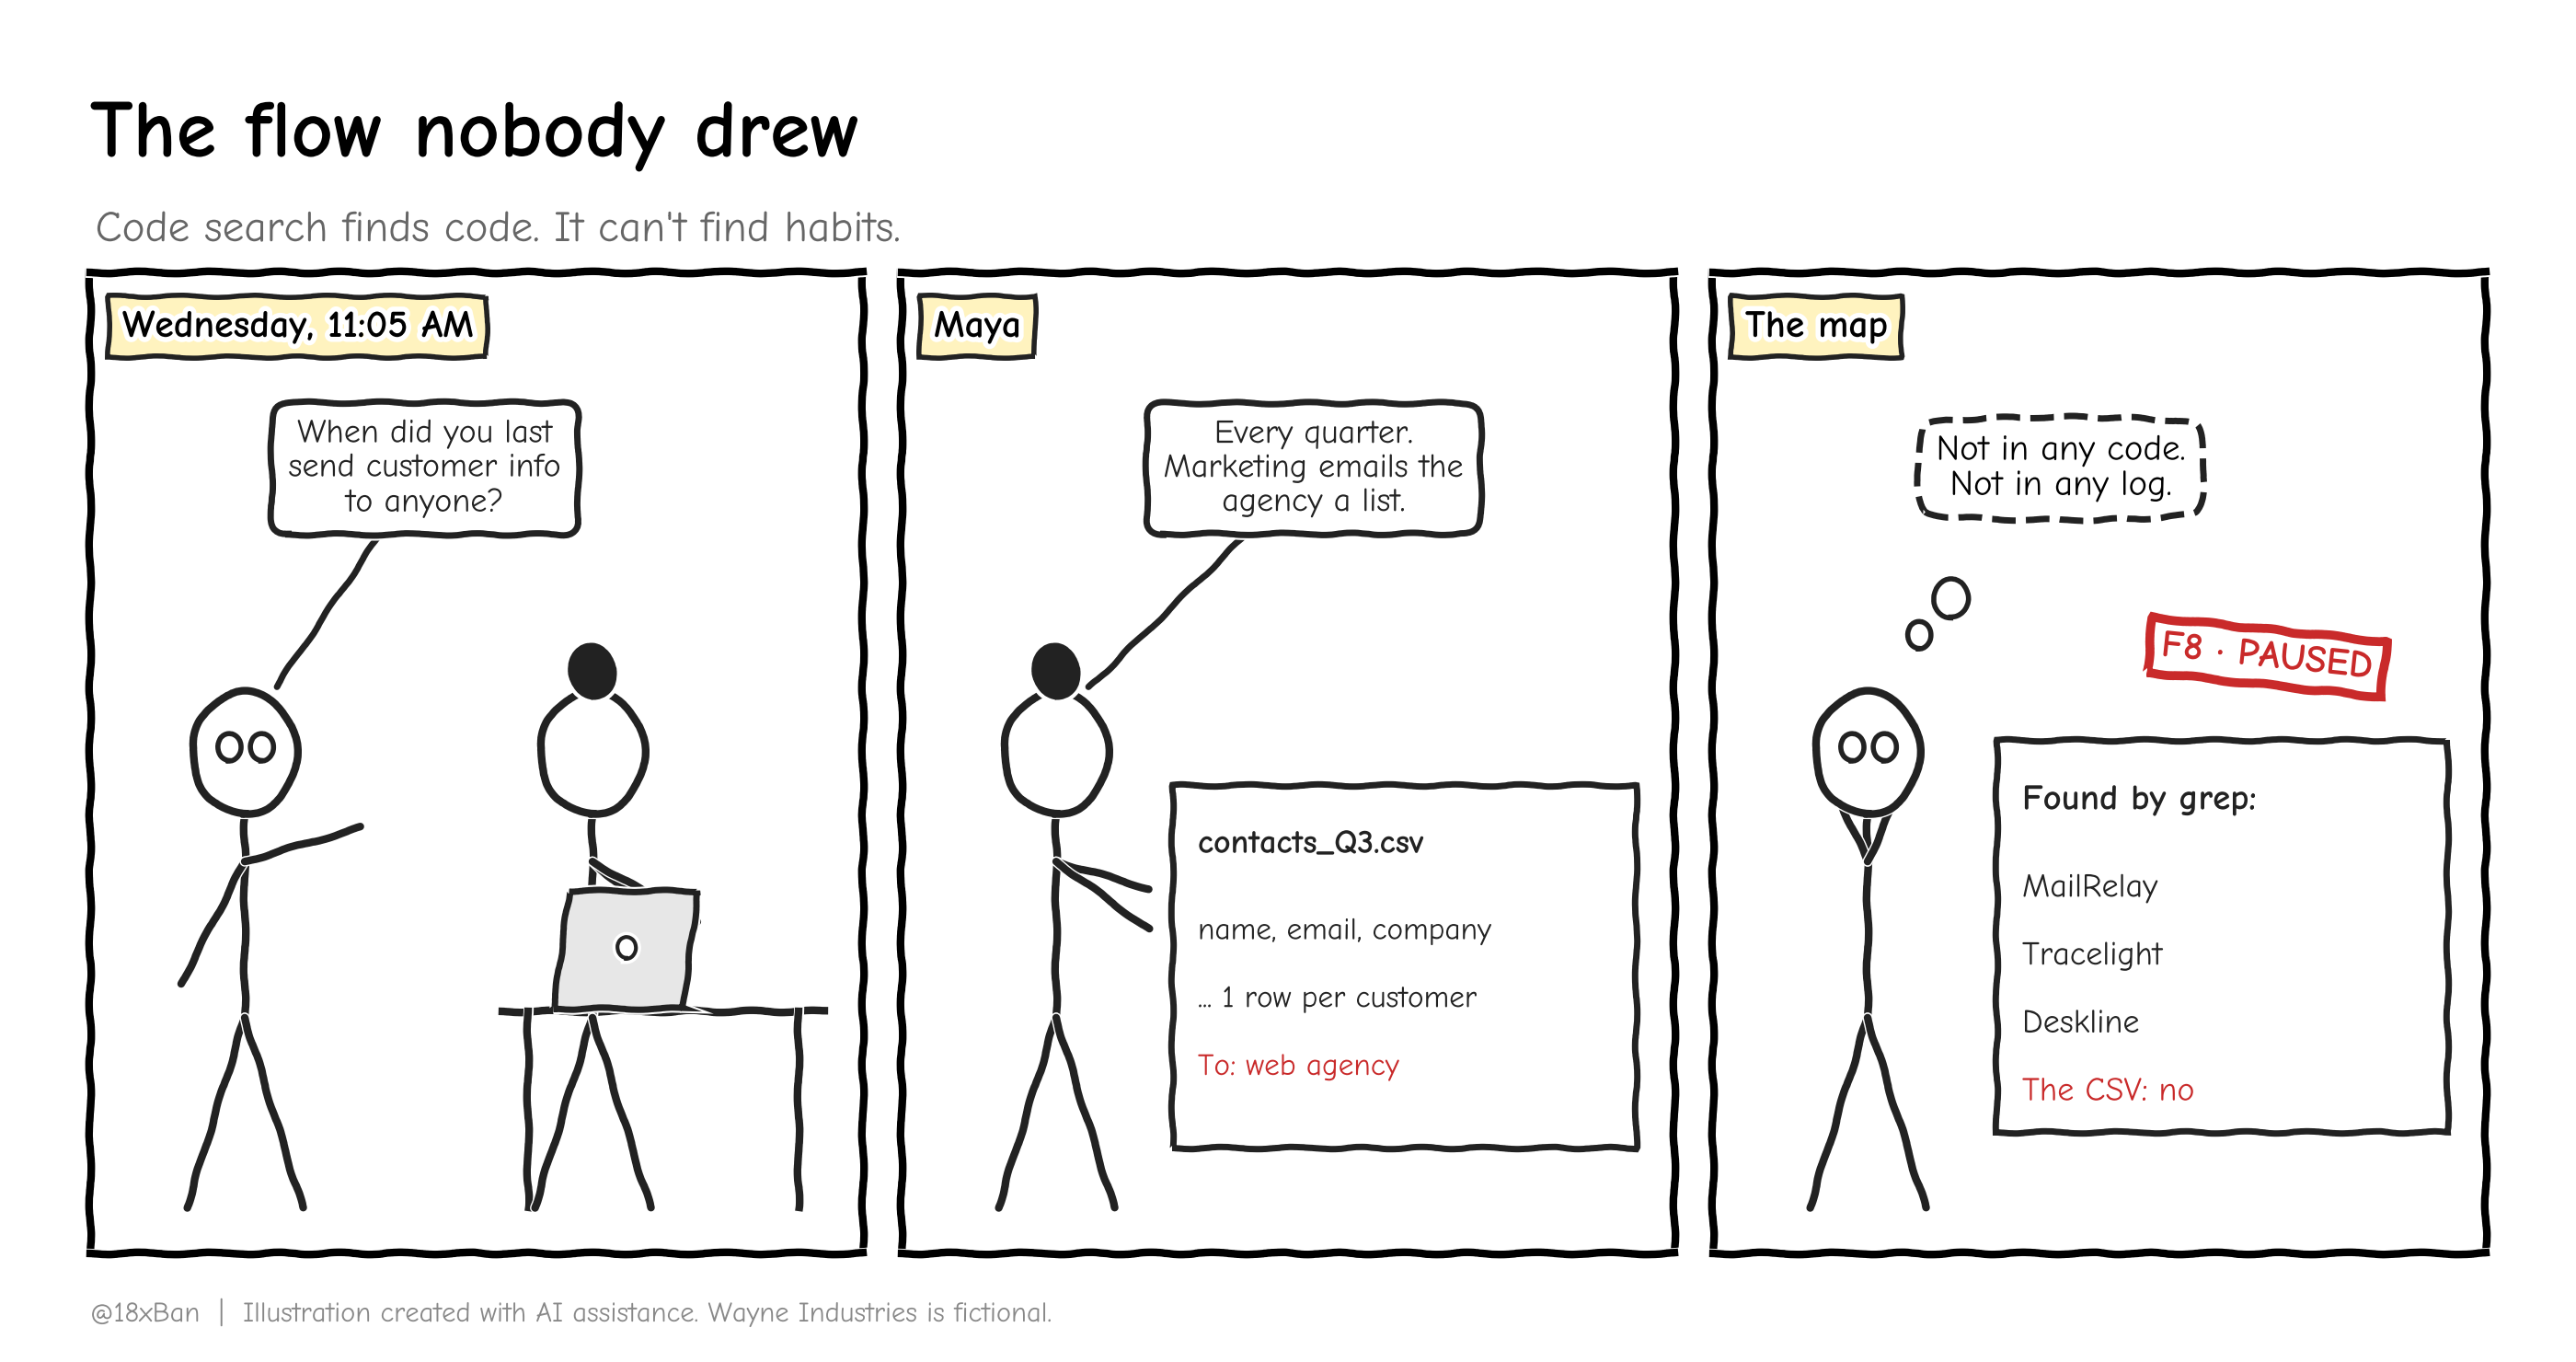
No API, no log, no diagram. Just a spreadsheet, every quarter.
Step 2: Draw the boundaries
With the flows found, the diagram almost draws itself. Wayne's map has four trust boundaries:
| Boundary | Between | What crossing it should require |
|---|---|---|
| TB1 | The internet and Wayne production | TLS, authentication, rate limits |
| TB2 | Production and non-production (staging, dev) | No Restricted data crosses, ever |
| TB3 | Wayne and third parties, including other countries | A reviewed vendor, a contract, a documented location |
| TB4 | Wayne systems and people's email or laptops | A business reason, an approver, and the least data needed |
TB2 is the rule the classification scheme already implied. Last week's scheme said Restricted data lives in wayne-prod only. The map shows exactly where that rule was broken, and how.
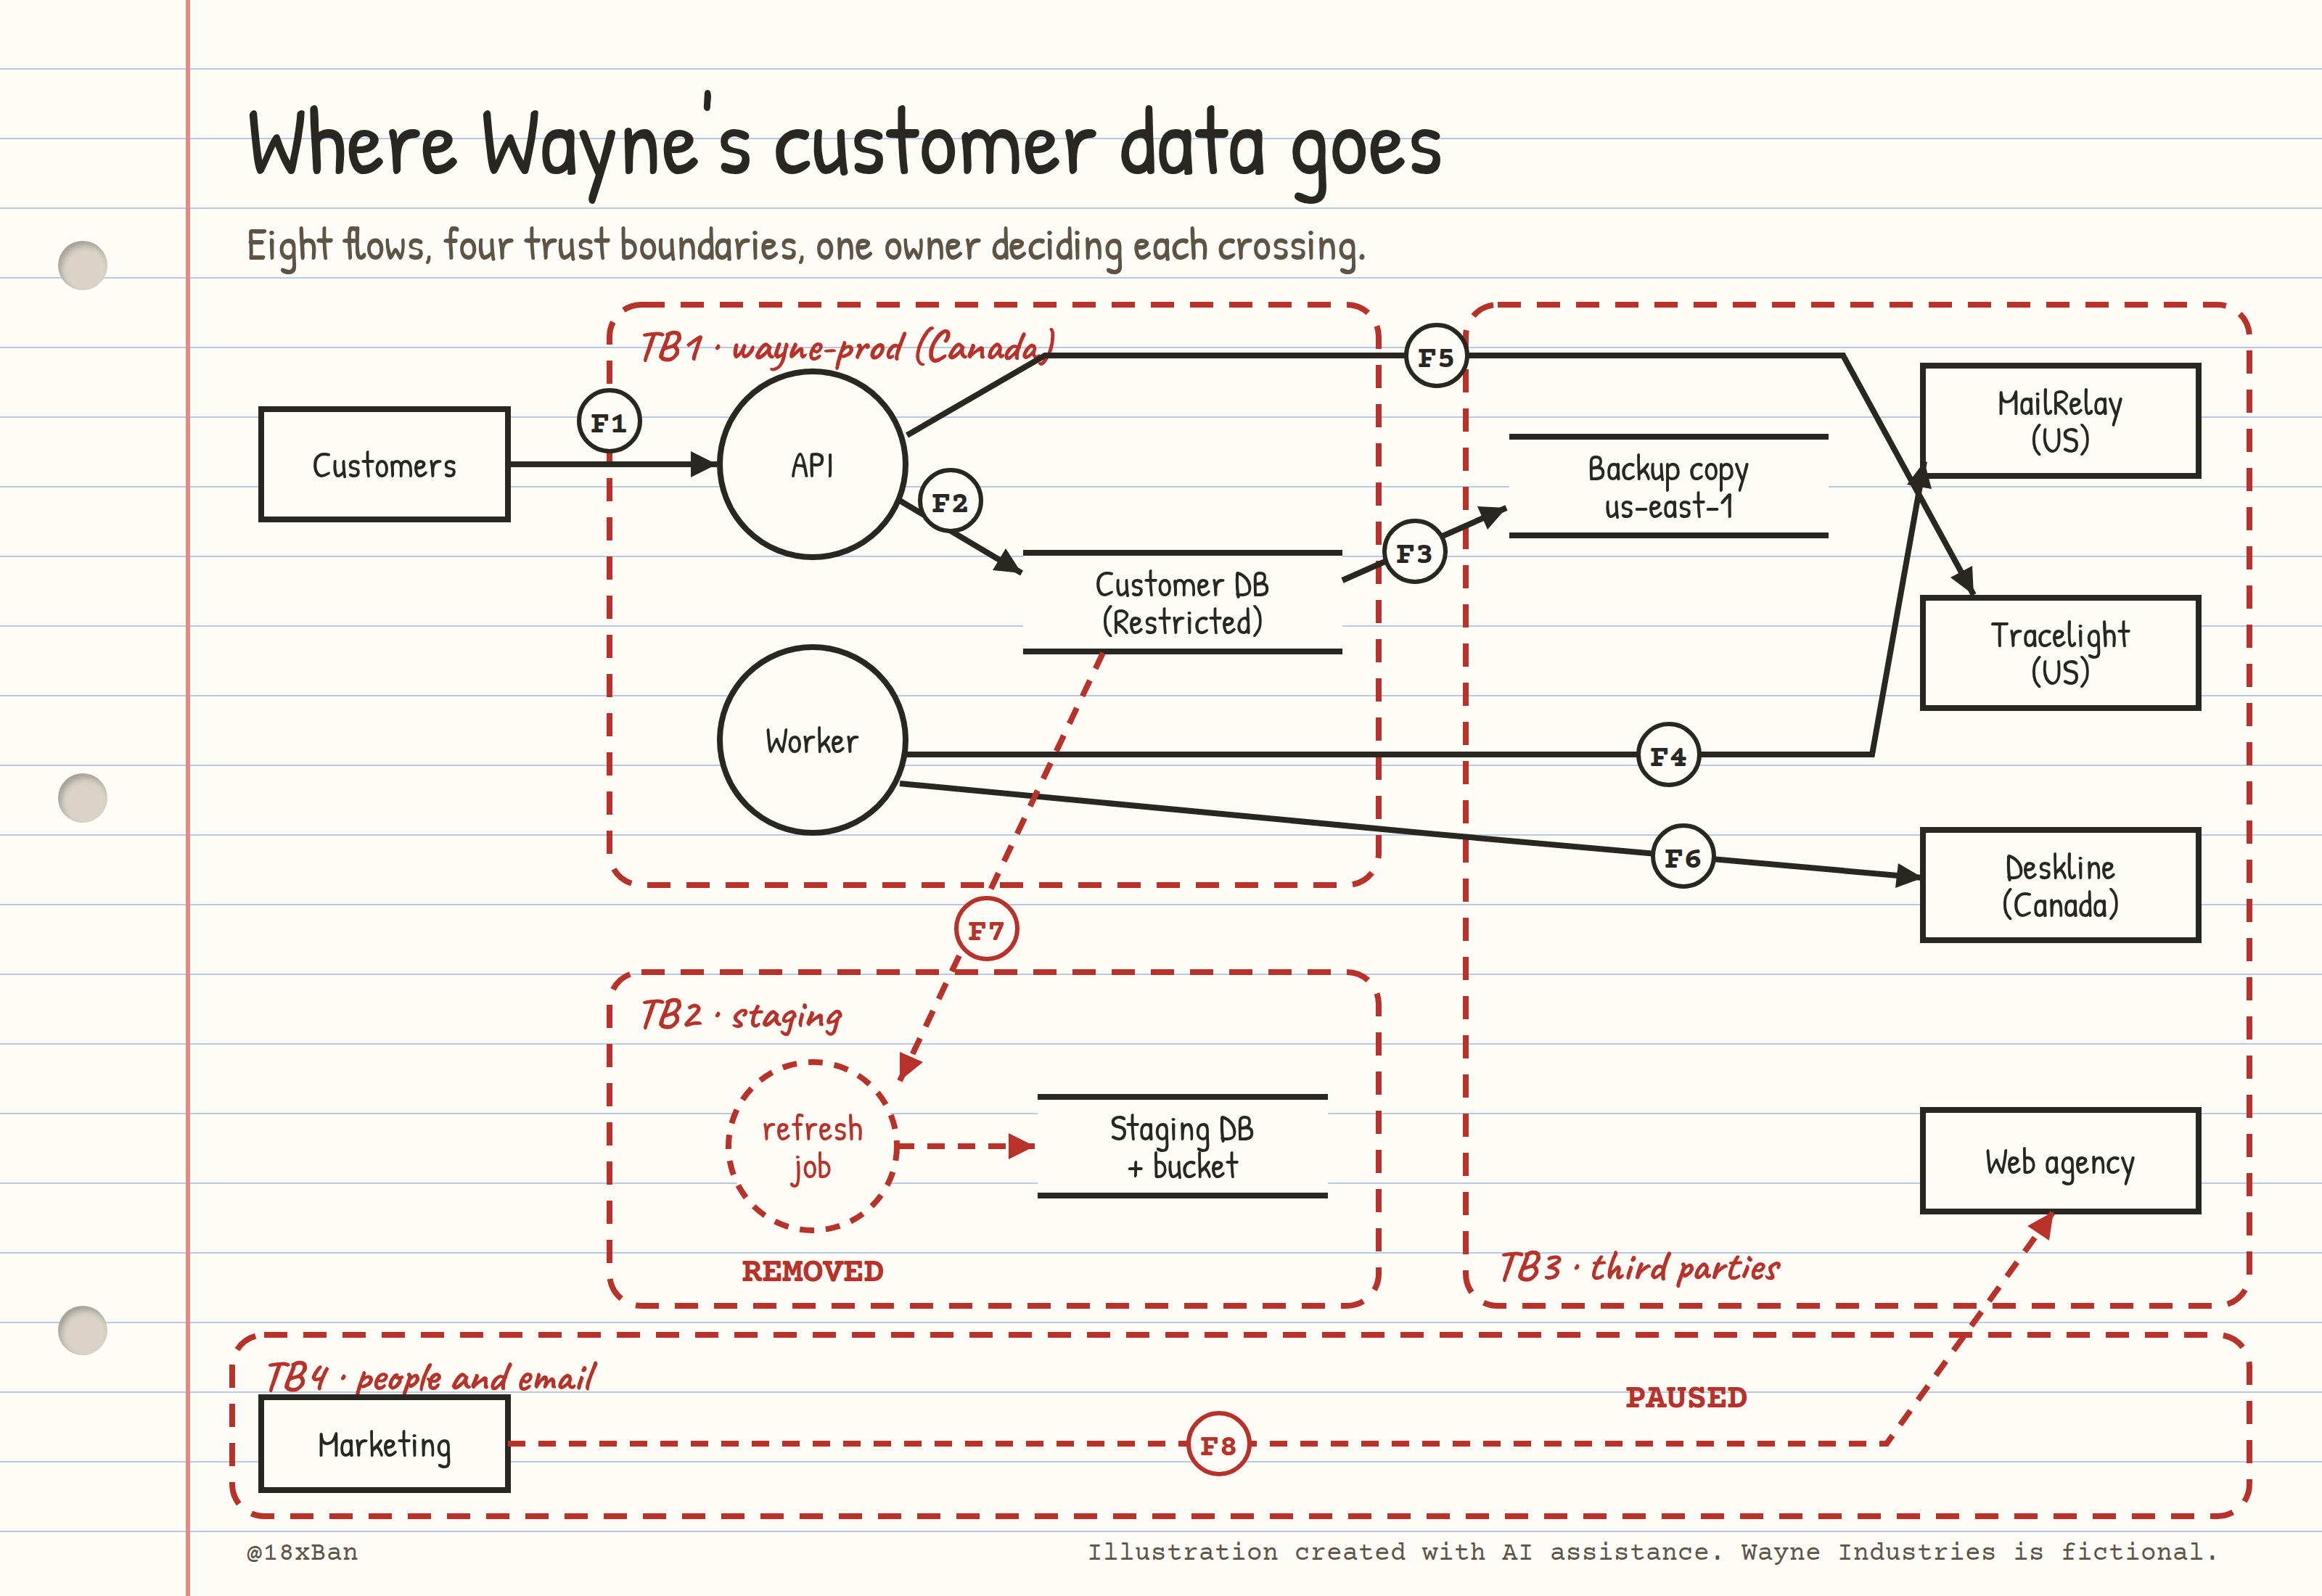
Wayne's customer data, with every boundary crossing numbered.
Step 3: Turn the picture into a register
Threat Dragon saves the model as JSON, so you can pull every flow into a table and track decisions against it:
jq -r '.detail.diagrams[].cells[]
  | select(.data.type == "tm.Flow")
  | [.data.name, .data.protocol, (.data.isEncrypted|tostring), (.data.isPublicNetwork|tostring)]
  | @tsv' wayne-customer-data.json | column -t -s $'\t'
F1 Customer sign-in and app use               HTTPS             true   true
F2 API reads and writes customer records      PostgreSQL/TLS    true   false
F3 Automated backup replication to us-east-1  AWS internal      true   false
F4 Transactional email: name + email          HTTPS             true   true
F5 Error events with stack traces             HTTPS             true   true
F6 Support tickets                            HTTPS             true   true
F7 refresh-staging: prod dump to staging      pg_dump + S3      false  false
F8 Quarterly contact list to web agency       Email attachment  false  true
Sample output (illustrative). Wayne Industries is fictional.
Two false values in the "encrypted" column, and both are on flows nobody had drawn. That's not a coincidence. Undocumented flows are the ones nobody ever checked.
Step 4: Decide every crossing
The map tells you what exists. Dan, as the owner of customer data, decides what's allowed to keep existing. You sit down with him on Wednesday afternoon and go flow by flow.
Wayne after (approved by Dan, Wednesday)
| Flow | Crosses | Decision | Owner |
|---|---|---|---|
| F1 Customer sign-in | TB1 | Keep. Already documented. | Priya |
| F2 API to database | — | Keep. Inside production. | Priya |
| F3 Backup copy to us-east-1 | TB3 | Keep for disaster recovery. Now documented and added to the customer-facing list of data locations. | Dan |
| F4 MailRelay | TB3 | Keep. Send name and email only. Vendor review queued. | You |
| F5 Tracelight | TB3 | Keep, but turn on data scrubbing so emails and request bodies are stripped before sending. Retest after. | Priya |
| F6 Deskline | TB3 | Keep. Vendor review queued. | You |
| F7 refresh-staging | TB2 | Remove. Delete the schedule and the job, revoke ci_refresh, and reseed staging with synthetic data. |
Priya |
| F8 Contact list to agency | TB3, TB4 | Paused by Maya until the agency is reviewed. | Maya |
A few things happen by Friday:
Priya's merge request removes
refresh_stagingand the script.ci_refreshloses its login.Dan checks with counsel, who confirm the private staging database isn't needed for the exposure question. Staging is wiped and reseeded with fake data.
Tracelight scrubbing is on. A forced test error arrives with
[Filtered]where the email used to be.The original export (
prod-export-2024.sql.gz) stays held, as before. Counsel now has the full map to work from.The diagram goes to Gotham Mutual for Q58, with the vendor names and countries listed.
Dan's written approval of the map, dated Wednesday, plus the merged change removing F7, become Evidence #5.
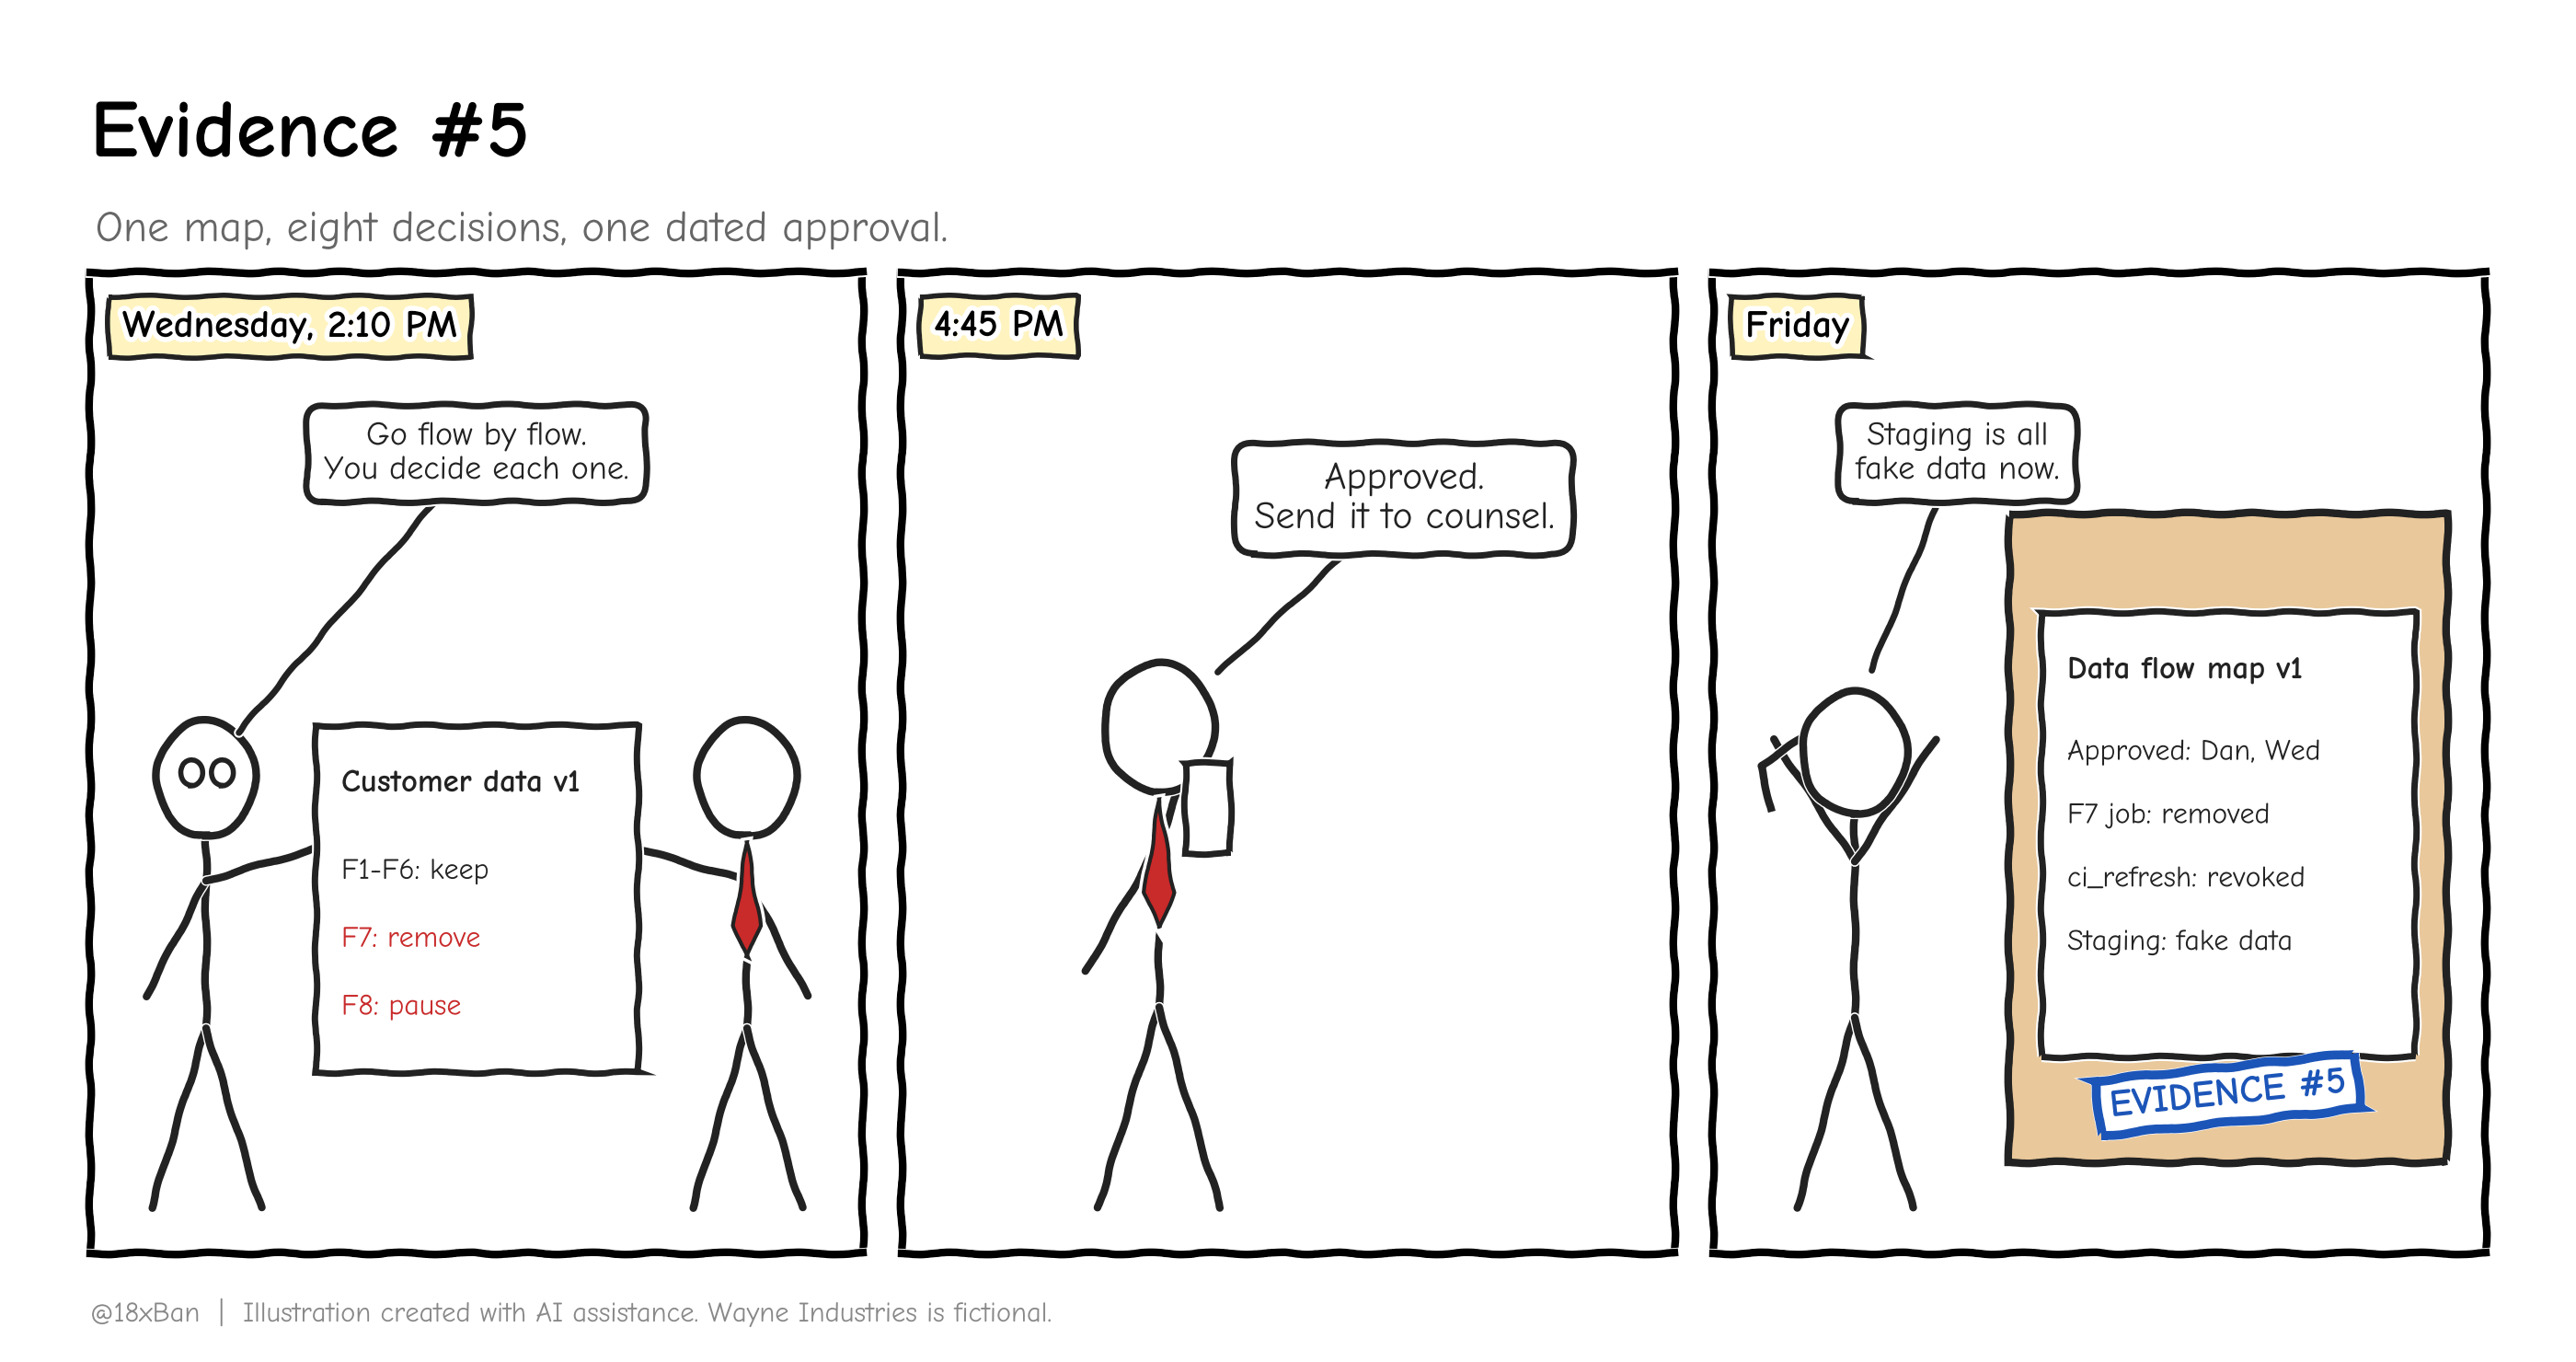
One map, eight decisions, one dated approval.
The unpopular truth: a data flow map is wrong the week after you draw it, unless something forces an update. Don't rely on "review annually." Tie it to change: a new vendor, a new integration, a new CI job that touches production. At Wayne, any merge request that adds an outbound URL or a production database role now needs a line in the map.
The flow register, before and after
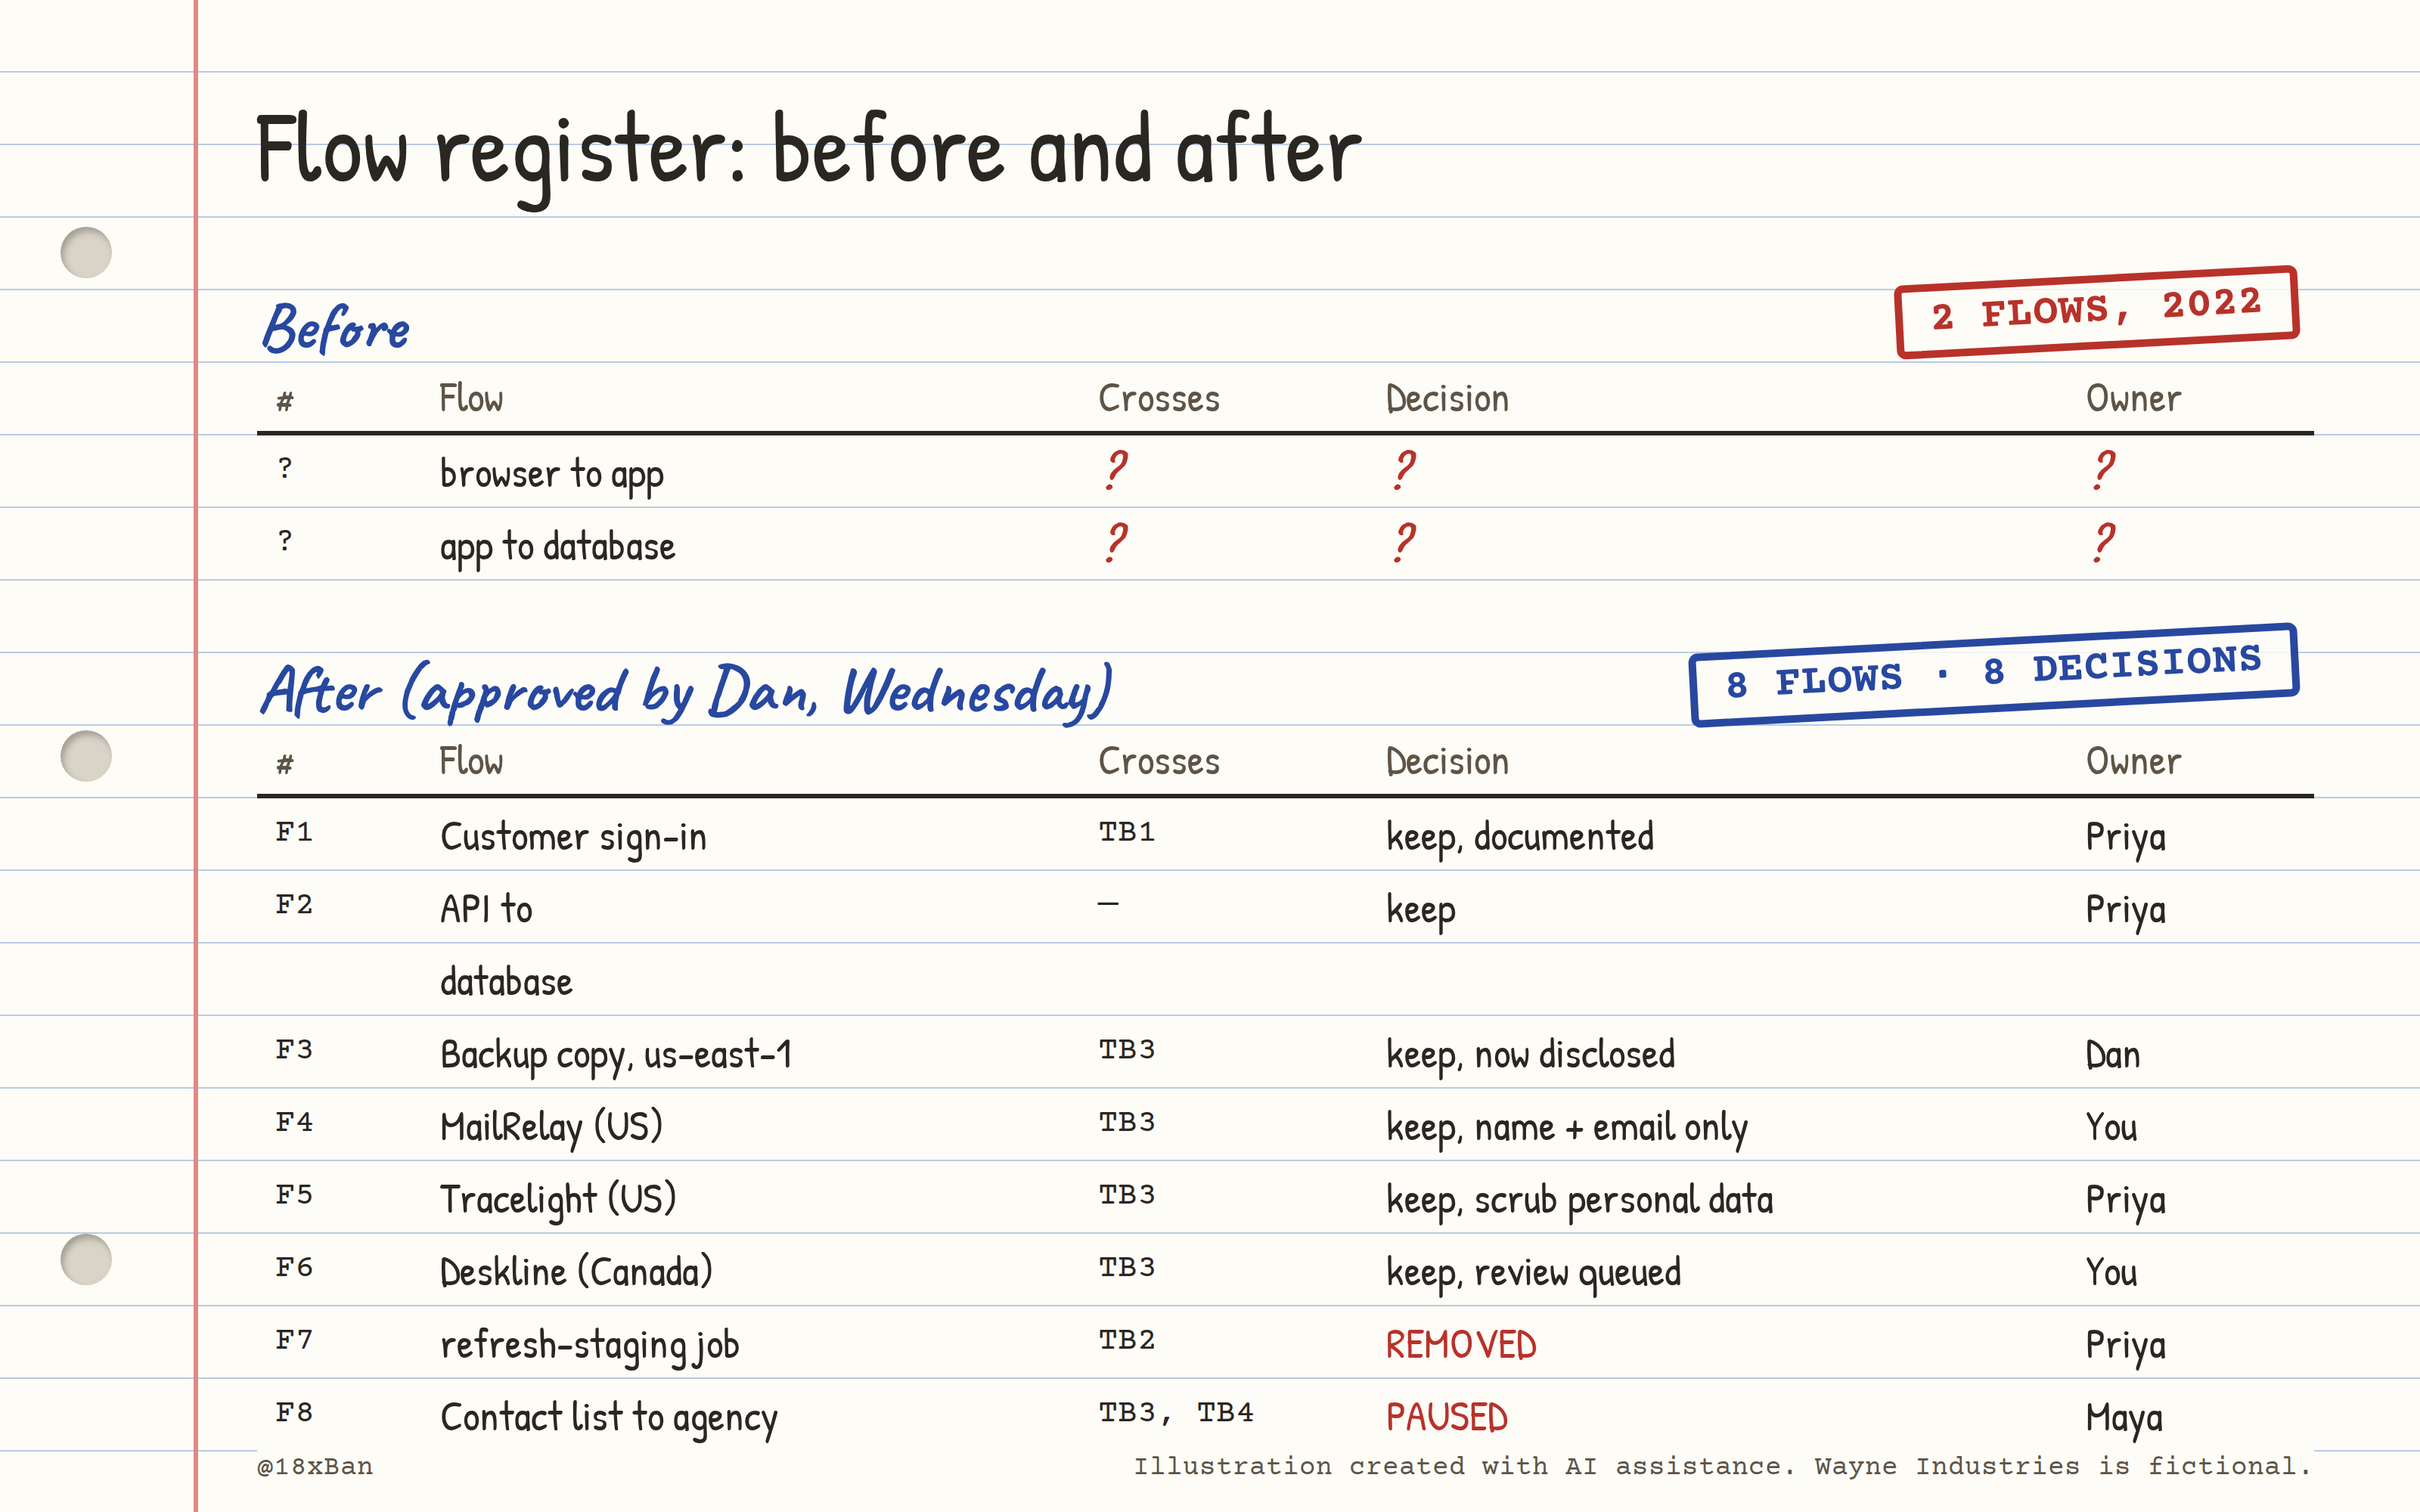
Two flows on paper became eight flows with owners and decisions.
| Before | After | |
|---|---|---|
| Flows documented | 2 | 8 |
| Trust boundaries drawn | 0 | 4 |
| Third parties shown | 0 | 4 (MailRelay, Tracelight, Deskline, web agency) |
| Flows leaving Canada | unknown | 3 (F3, F4, F5), all documented |
| Restricted flows crossing prod to staging | unknown | 0 (F7 removed) |
| Flows with a named owner and decision | 0 | 8 |
| Map approved by | nobody | Dan Okafor, Wednesday |
What an auditor accepts vs rejects
| The auditor asks | Rejected | Accepted |
|---|---|---|
| "Show me your data flow documentation." | An architecture diagram with no data, no vendors, no date | A dated DFD with trust boundaries, approved by a named owner |
| "Does it include service providers?" | "Those are in procurement's list somewhere." | Vendors on the map, with the data they receive and where they process it |
| "Is it current?" | "It was accurate when we drew it." | A review date, plus a rule that ties updates to changes |
| "Show me this flow in the real system." | Someone explains it from memory | The config, job or setting that matches the arrow on the map |
| "How do you know nothing is missing?" | "We asked the architect." | Watch, read and ask: live connections, code and config search, and interviews |
| "What happens when a flow breaks your rules?" | A comment in a meeting | A decision per flow, with an owner and a closed change |
What you actually do on Monday
Pick your most sensitive data store. Start there, not with the whole company.
Watch: list live connections and every account that can log in.
Read: search code and config for outbound URLs, bucket names and database roles.
Read the cloud: check backup copies, replication and cross-region settings.
Ask: "When did you last send customer information to anyone?" Ask marketing, support and finance, not just engineering.
Draw it in Threat Dragon. Four shapes, plus dashed lines where trust changes.
Number every flow that crosses a boundary, and get the data owner to decide each one.
Tie updates to change, not just to the calendar.
Where data flow mapping lives in the frameworks
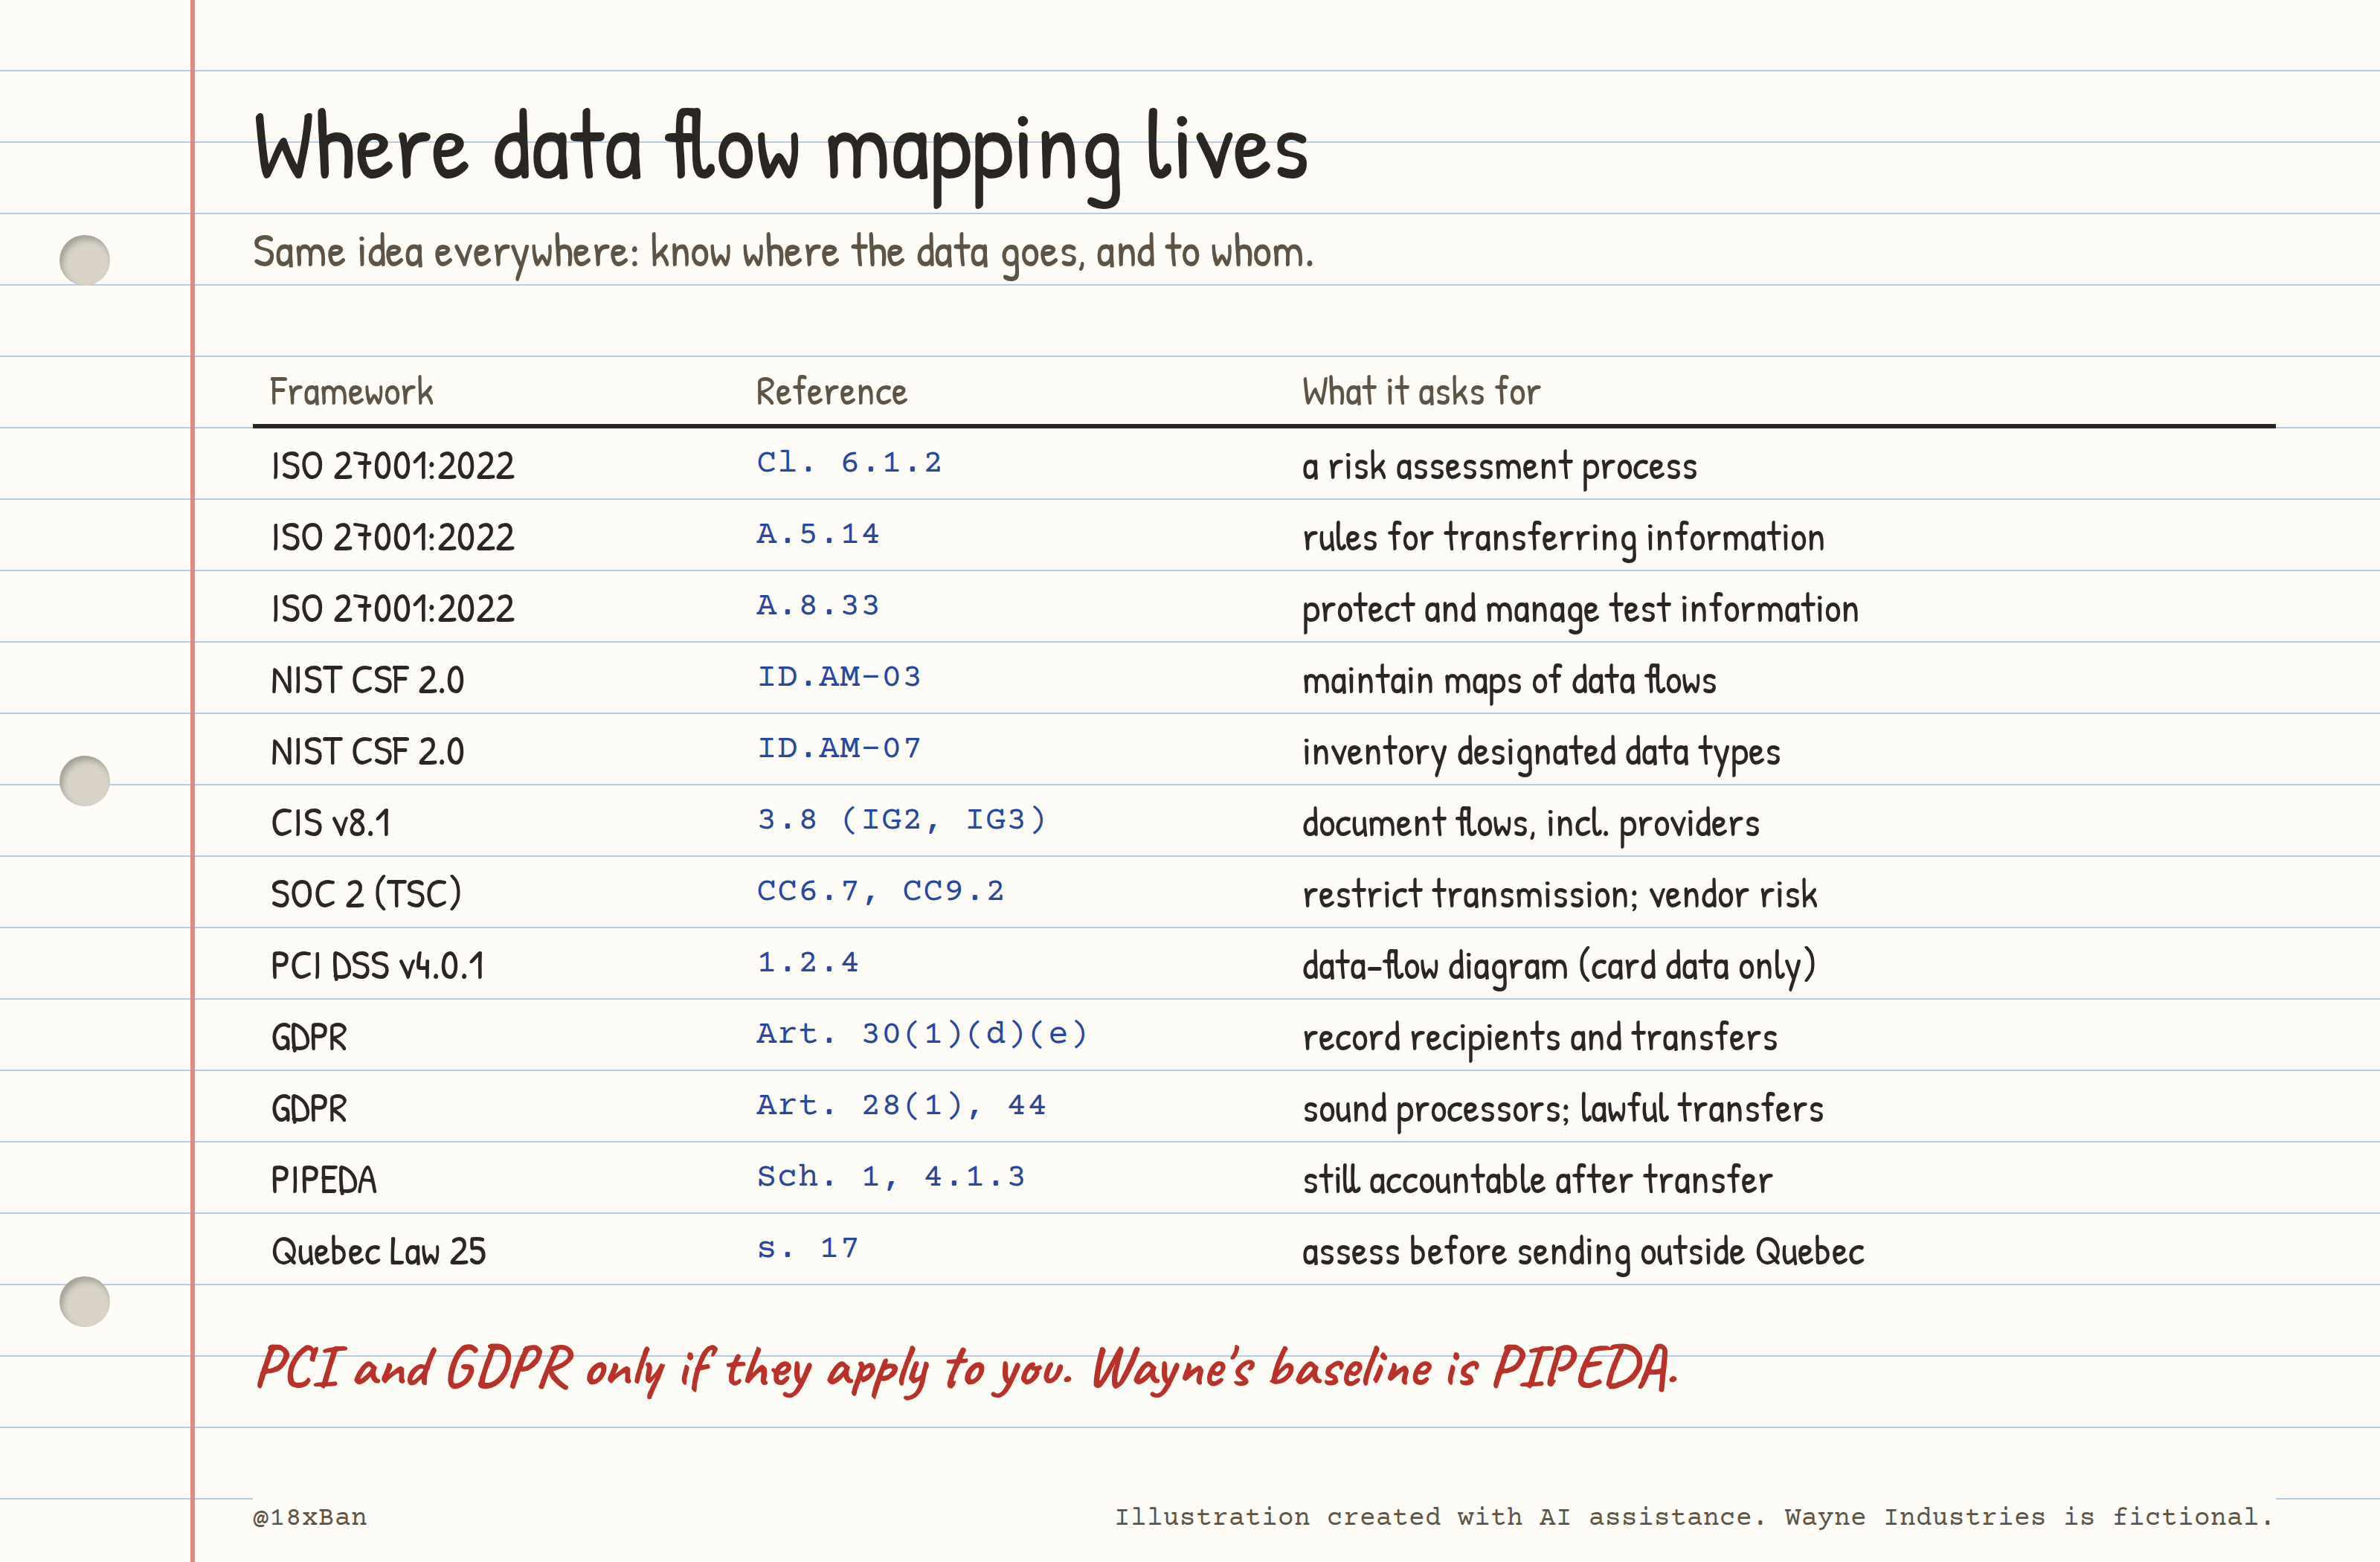
Every framework asks the same thing: know where the data goes, and who it goes to.
Maturity ladder
| Stage | 20 people | 200 people | 2,000 people |
|---|---|---|---|
| Diagram | One page, drawn by hand or in a free tool, for customer data only | A Threat Dragon model per product, stored in Git | Models per system, linked to an architecture repository |
| Discovery | Ask the three people who touch customer data | Watch, read and ask, twice a year | Automated data discovery and network flow analysis |
| Third parties | A list of vendors that receive customer data | Vendors on the map with data types and countries | Subprocessor register tied to contracts and transfer assessments |
| Change trigger | "Tell security if you add a vendor" | Merge requests that add outbound URLs or prod roles need a map update | Architecture review gates and egress controls that block unapproved destinations |
| Evidence | A dated email approving the diagram | Approved map, flow register with owners, change history in Git | Continuous reports of actual flows compared against approved flows |
Be honest about the left column. At 20 people, a hand-drawn diagram with a date and an owner's "approved" email is a real control.
Where Wayne sits: Wayne now has a 200-person map for customer data only. Discovery was a one-off effort by one person, and nothing technical blocks a new outbound flow yet. The rule tying map updates to merge requests is brand new and untested.
Cheatsheet
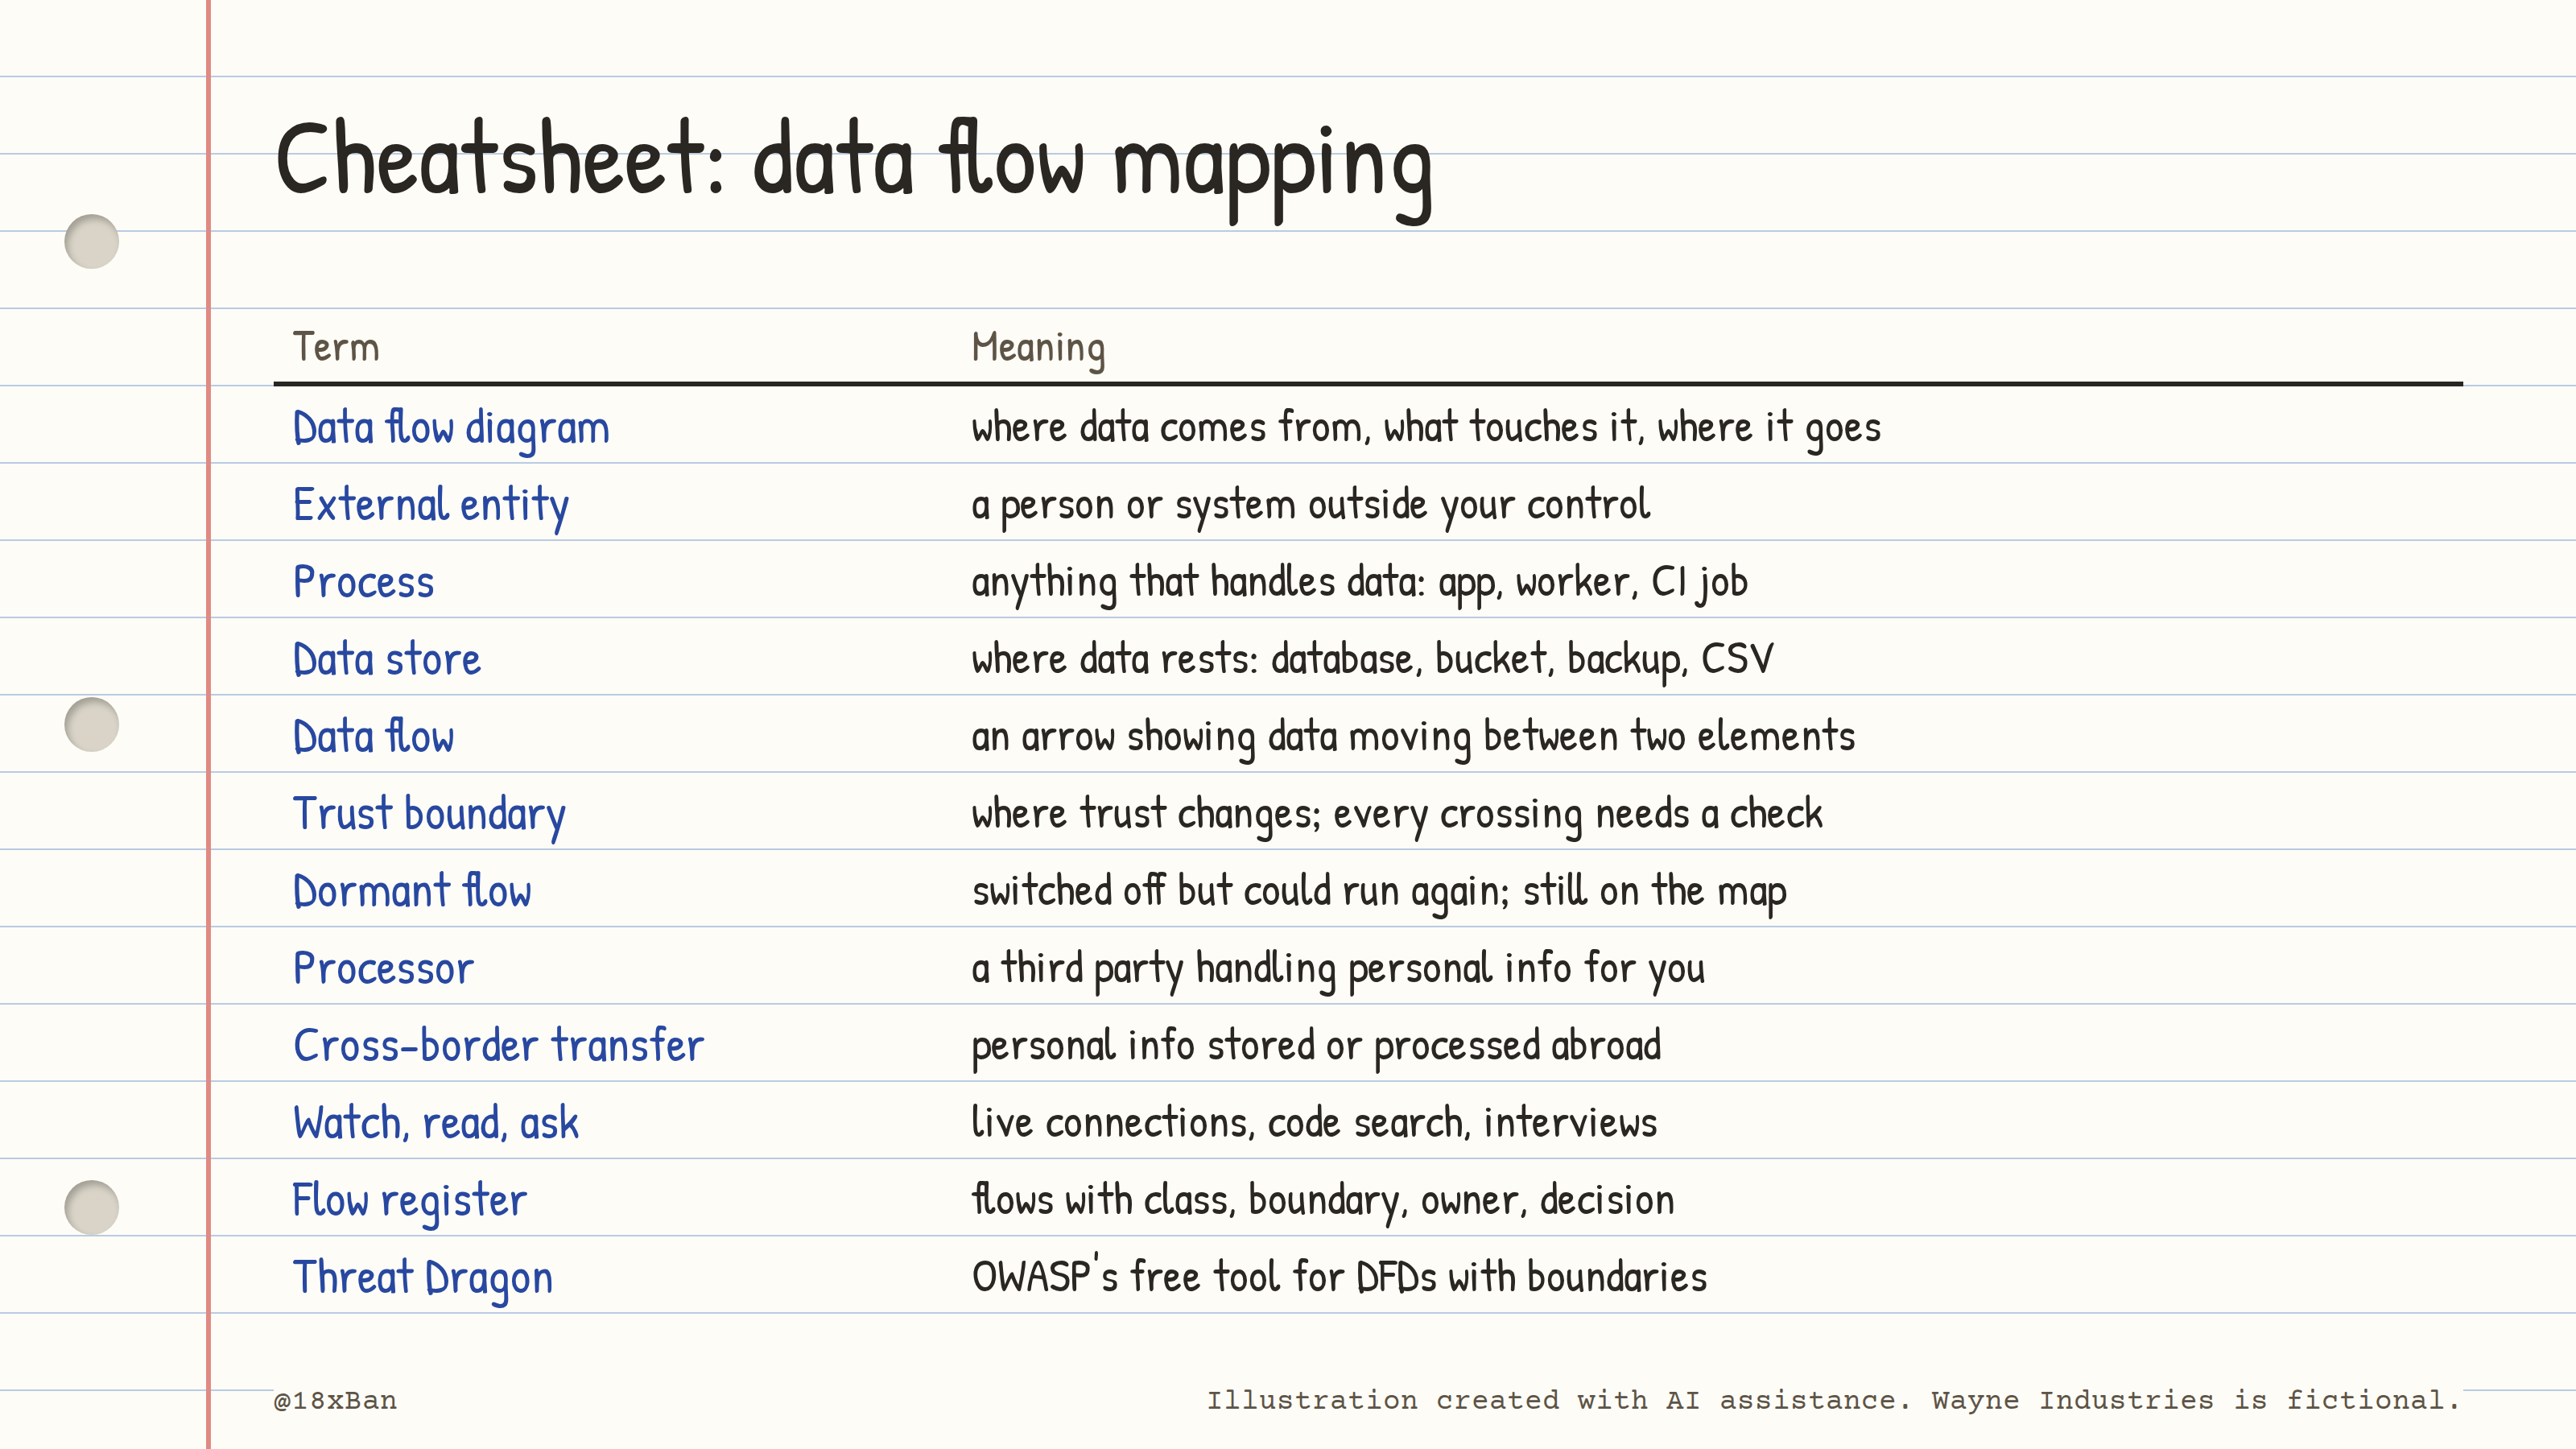
Data flow mapping, on one page.
The takeaway
Your architecture diagram shows how things are built. A data flow map shows where the data goes. Find flows three ways: watch, read and ask. Each one misses what the others catch. Draw trust boundaries, and make the data owner decide every crossing. Dormant flows count, and so do spreadsheets in emails.
⚠️ This content is for educational purposes only. Wayne Industries is a fictional company. Nothing here is legal, audit, or compliance advice, validate against your own auditor and jurisdiction.