Board Metrics That Actually Get Read
14 charts nobody acted on, and the 6 numbers that produced 3 decisions in 9minutes.
// @18xBan · GRC Series · Chapter 12
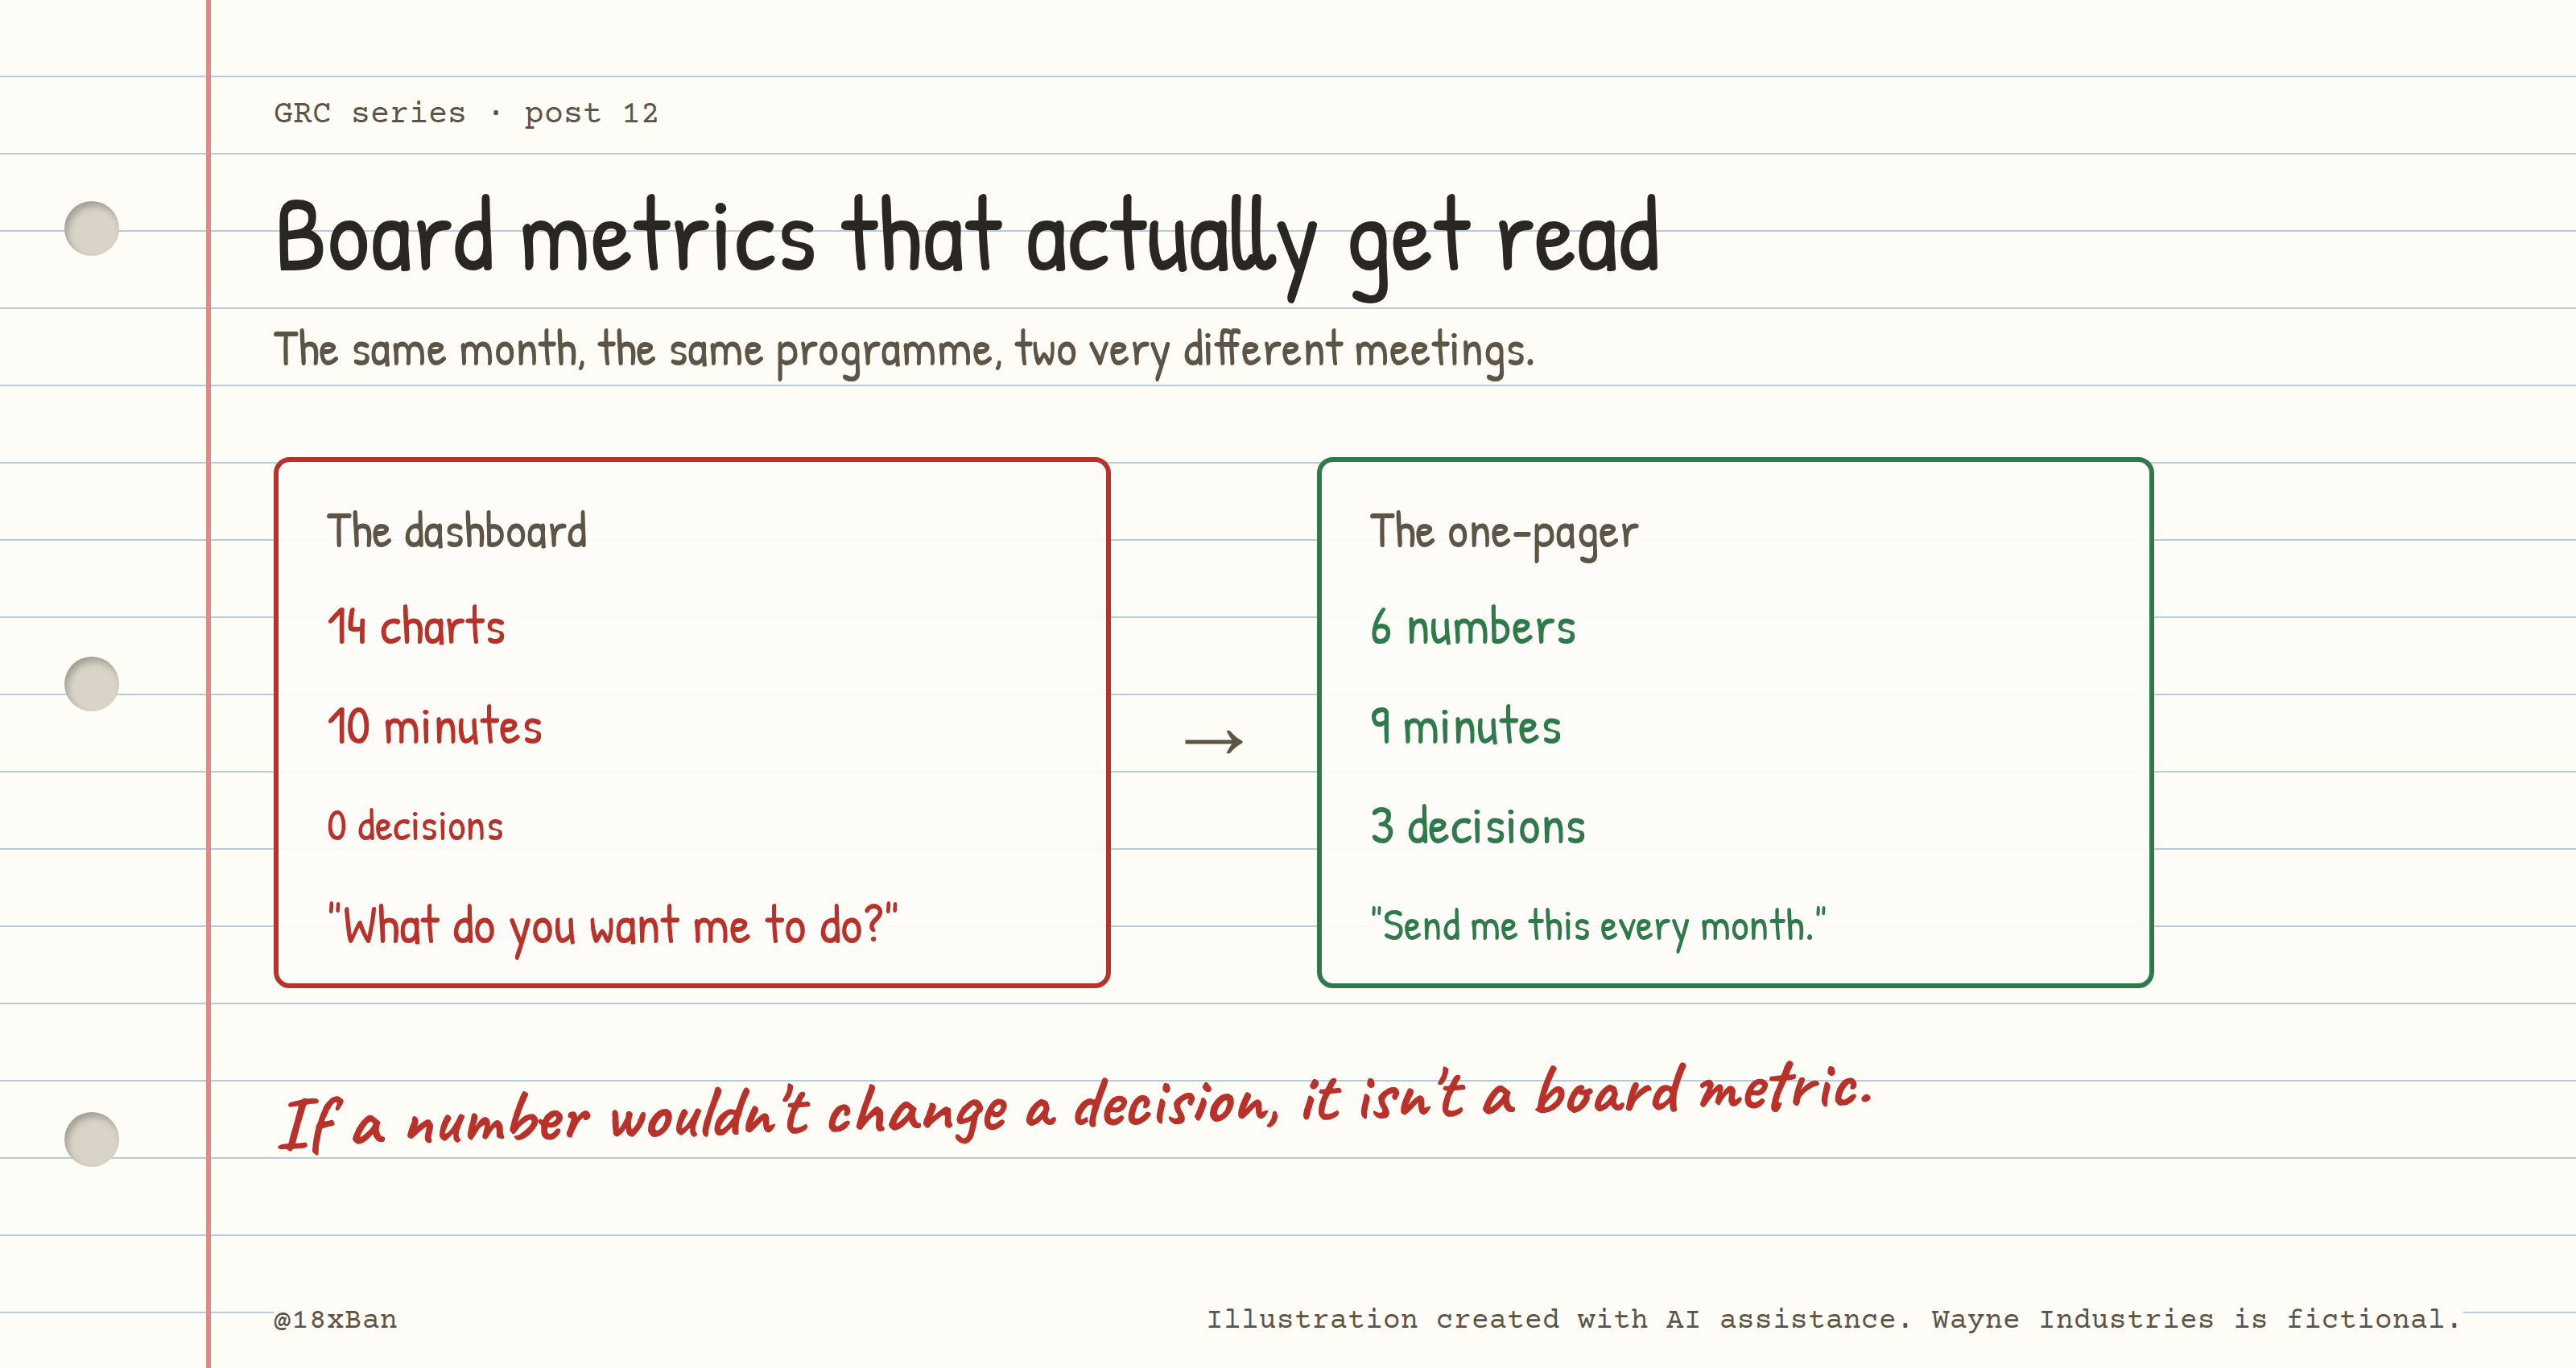
6 numbers, 3 decisions, one page.
Thursday, 2:00 PM: 14 Charts
Maya gives you 10 minutes at the monthly leadership meeting. It's the first time security has been on the agenda at all, which is its own small victory.
You spend Wednesday night building a dashboard. 14 charts. MFA coverage over time. Tickets closed. CIS IG1 progress. Accounts by OU. Log volume. A very satisfying donut chart of C2M2 domains.
4 minutes in, Dan is answering Slack messages. At minute 7 Maya stops you with the only question that matters:
"This is thorough. What do you want me to do?"
You don't have an answer, because the deck wasn't built to produce one. It was built to show that you'd been busy.
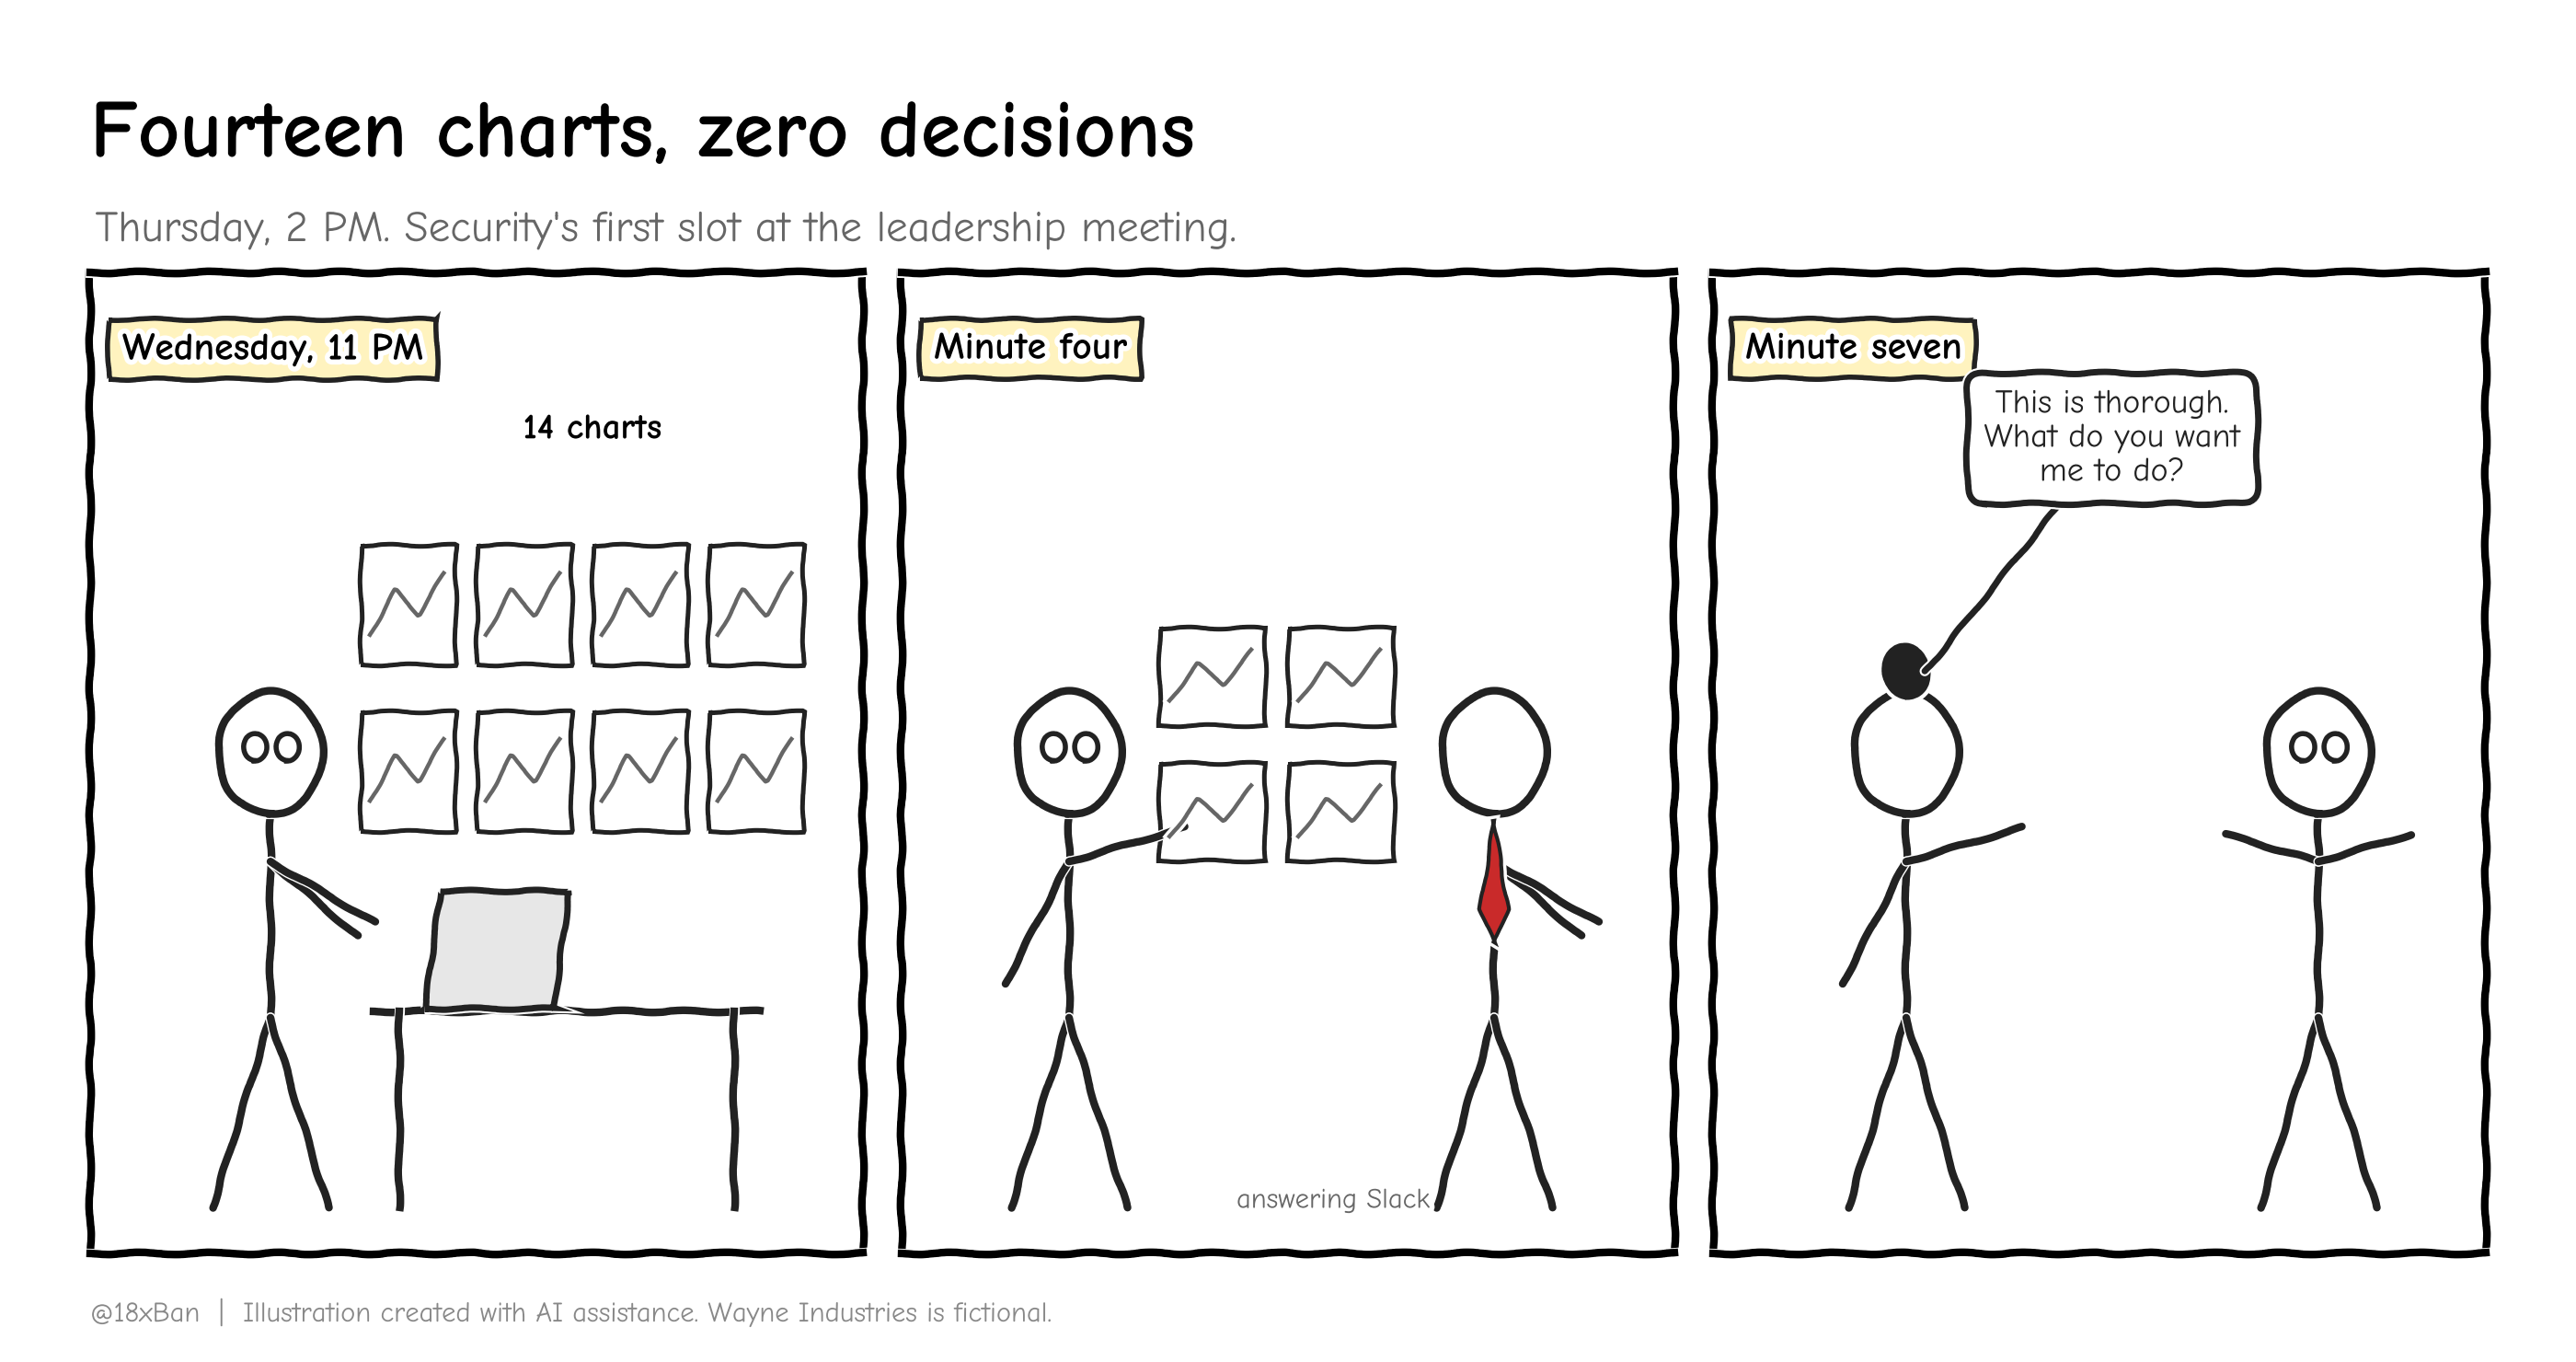
14 charts, 0 decisions.
The unpopular truth: most security dashboards are evidence that the security team exists. They are not decision support, and executives can smell the difference in about 90 seconds.
The test every number has to pass
Two questions, in order:
So what? What does this number tell us about risk or obligation?
Now what? What would we do differently if it moved?
If a number has no answer to the second question, it belongs in your own tracking, not in a board pack. "Log volume" fails. "We blocked 2.4 million attacks" fails spectacularly it goes up when attacks go up and when your filter gets noisier, and no decision follows either way.
Here's what usually appears in board packs, and what's wrong with it.
| Common metric | Why it fails | What to report instead |
|---|---|---|
| "2.4 million attacks blocked" | Measures internet weather, not your posture | Exposure that shouldn't exist, and how long it lasted |
| Tickets closed | Measures effort, not risk | Open items past their due date, by severity |
| 100% training completion | Measures clicking, not behaviour | Reported phishing rate, or time to report |
| "98% patch compliance" | Undefined population; the missing 2% is the whole question | Critical vulnerabilities older than your SLA, with the population defined |
| Number of incidents | Goes down when detection is bad | Time to detect and contain, plus what changed after |
| Maturity score alone | Interesting, but no decision attached | The blocking item behind the score, with a date |
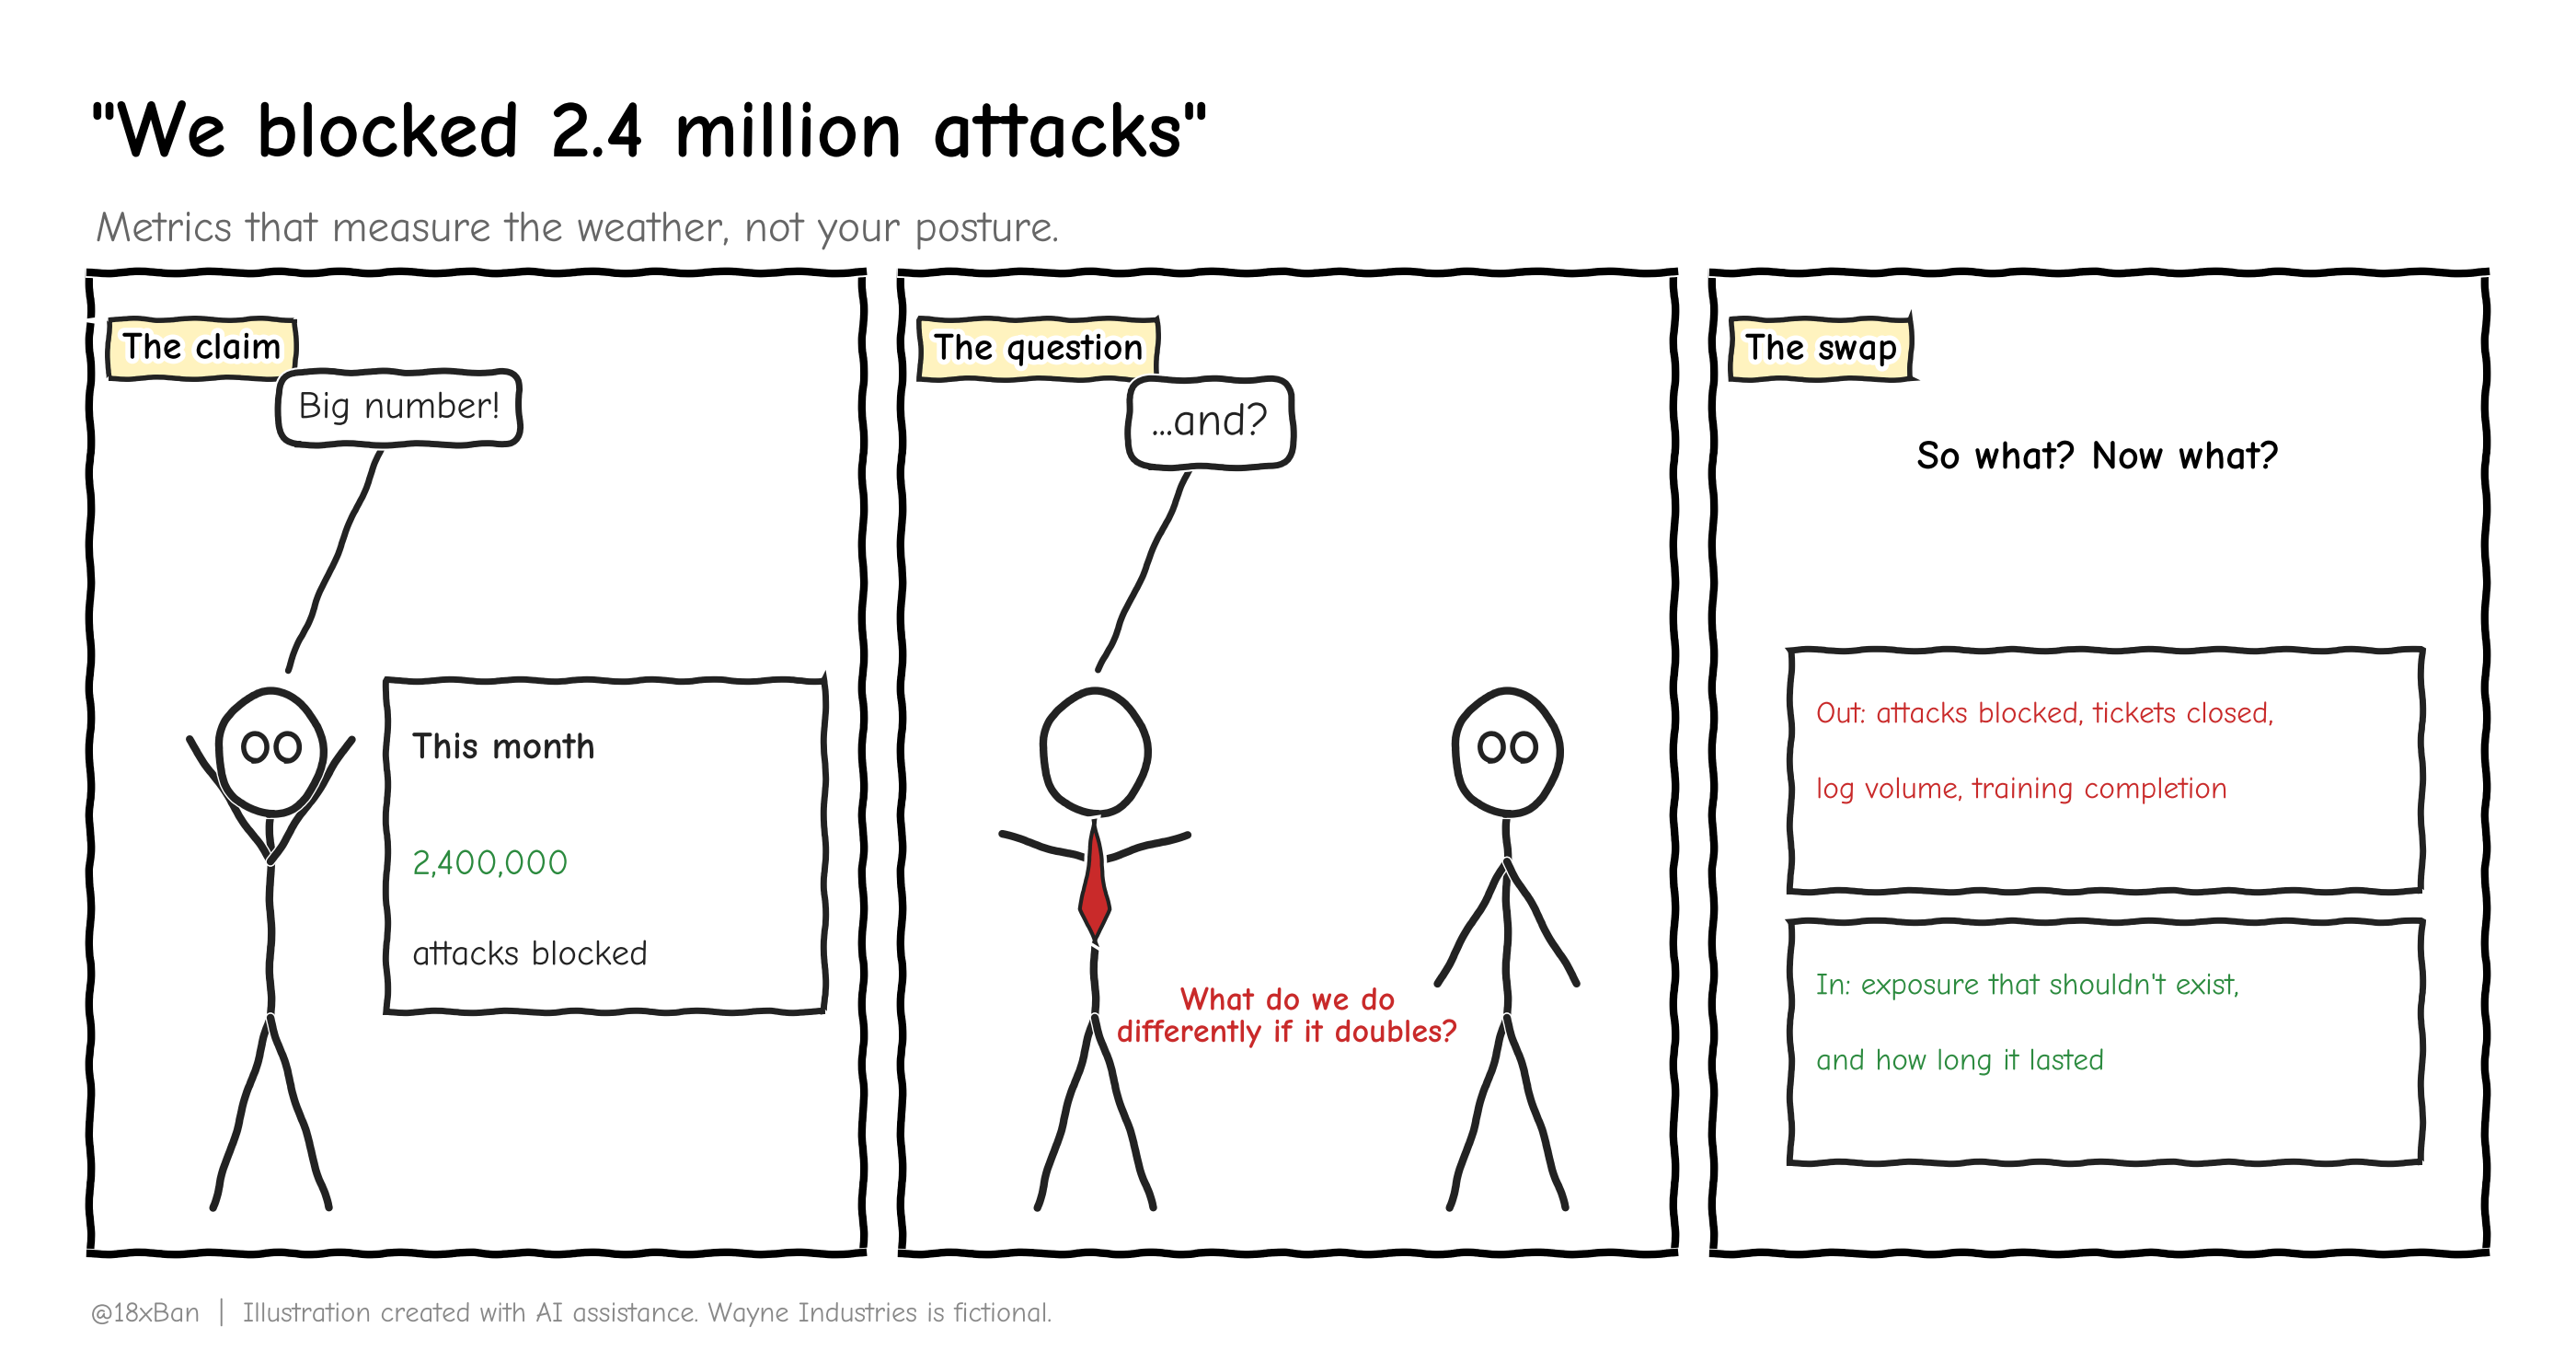
"We blocked 2.4 million attacks." "…and?"
KPI, KRI, and why the difference matters here
3 words get used interchangeably, and only one of them buys you a decision.
| Term | Answers | Looks | Example at Wayne |
|---|---|---|---|
| Metric | "What is the number?" | Neutral | 219 enabled accounts belonging to people |
| KPI | "How well are we doing the thing?" | Backwards | 78% of leavers disabled by end of last working day |
| KRI | "Is risk building up?" | Forwards | Share of privileged accounts without MFA |
A key risk indicator has one feature a KPI doesn't: a threshold agreed in advance, with an action attached. Not a colour. An action. "If privileged MFA coverage drops below 100% for more than 7 days, deploys are paused until it's fixed" is a KRI. "MFA is amber this month" is decoration.
The reason to agree thresholds in advance is simple: you're negotiating them when nobody is under pressure. In the middle of an incident, every threshold is renegotiable and every exception is urgent.
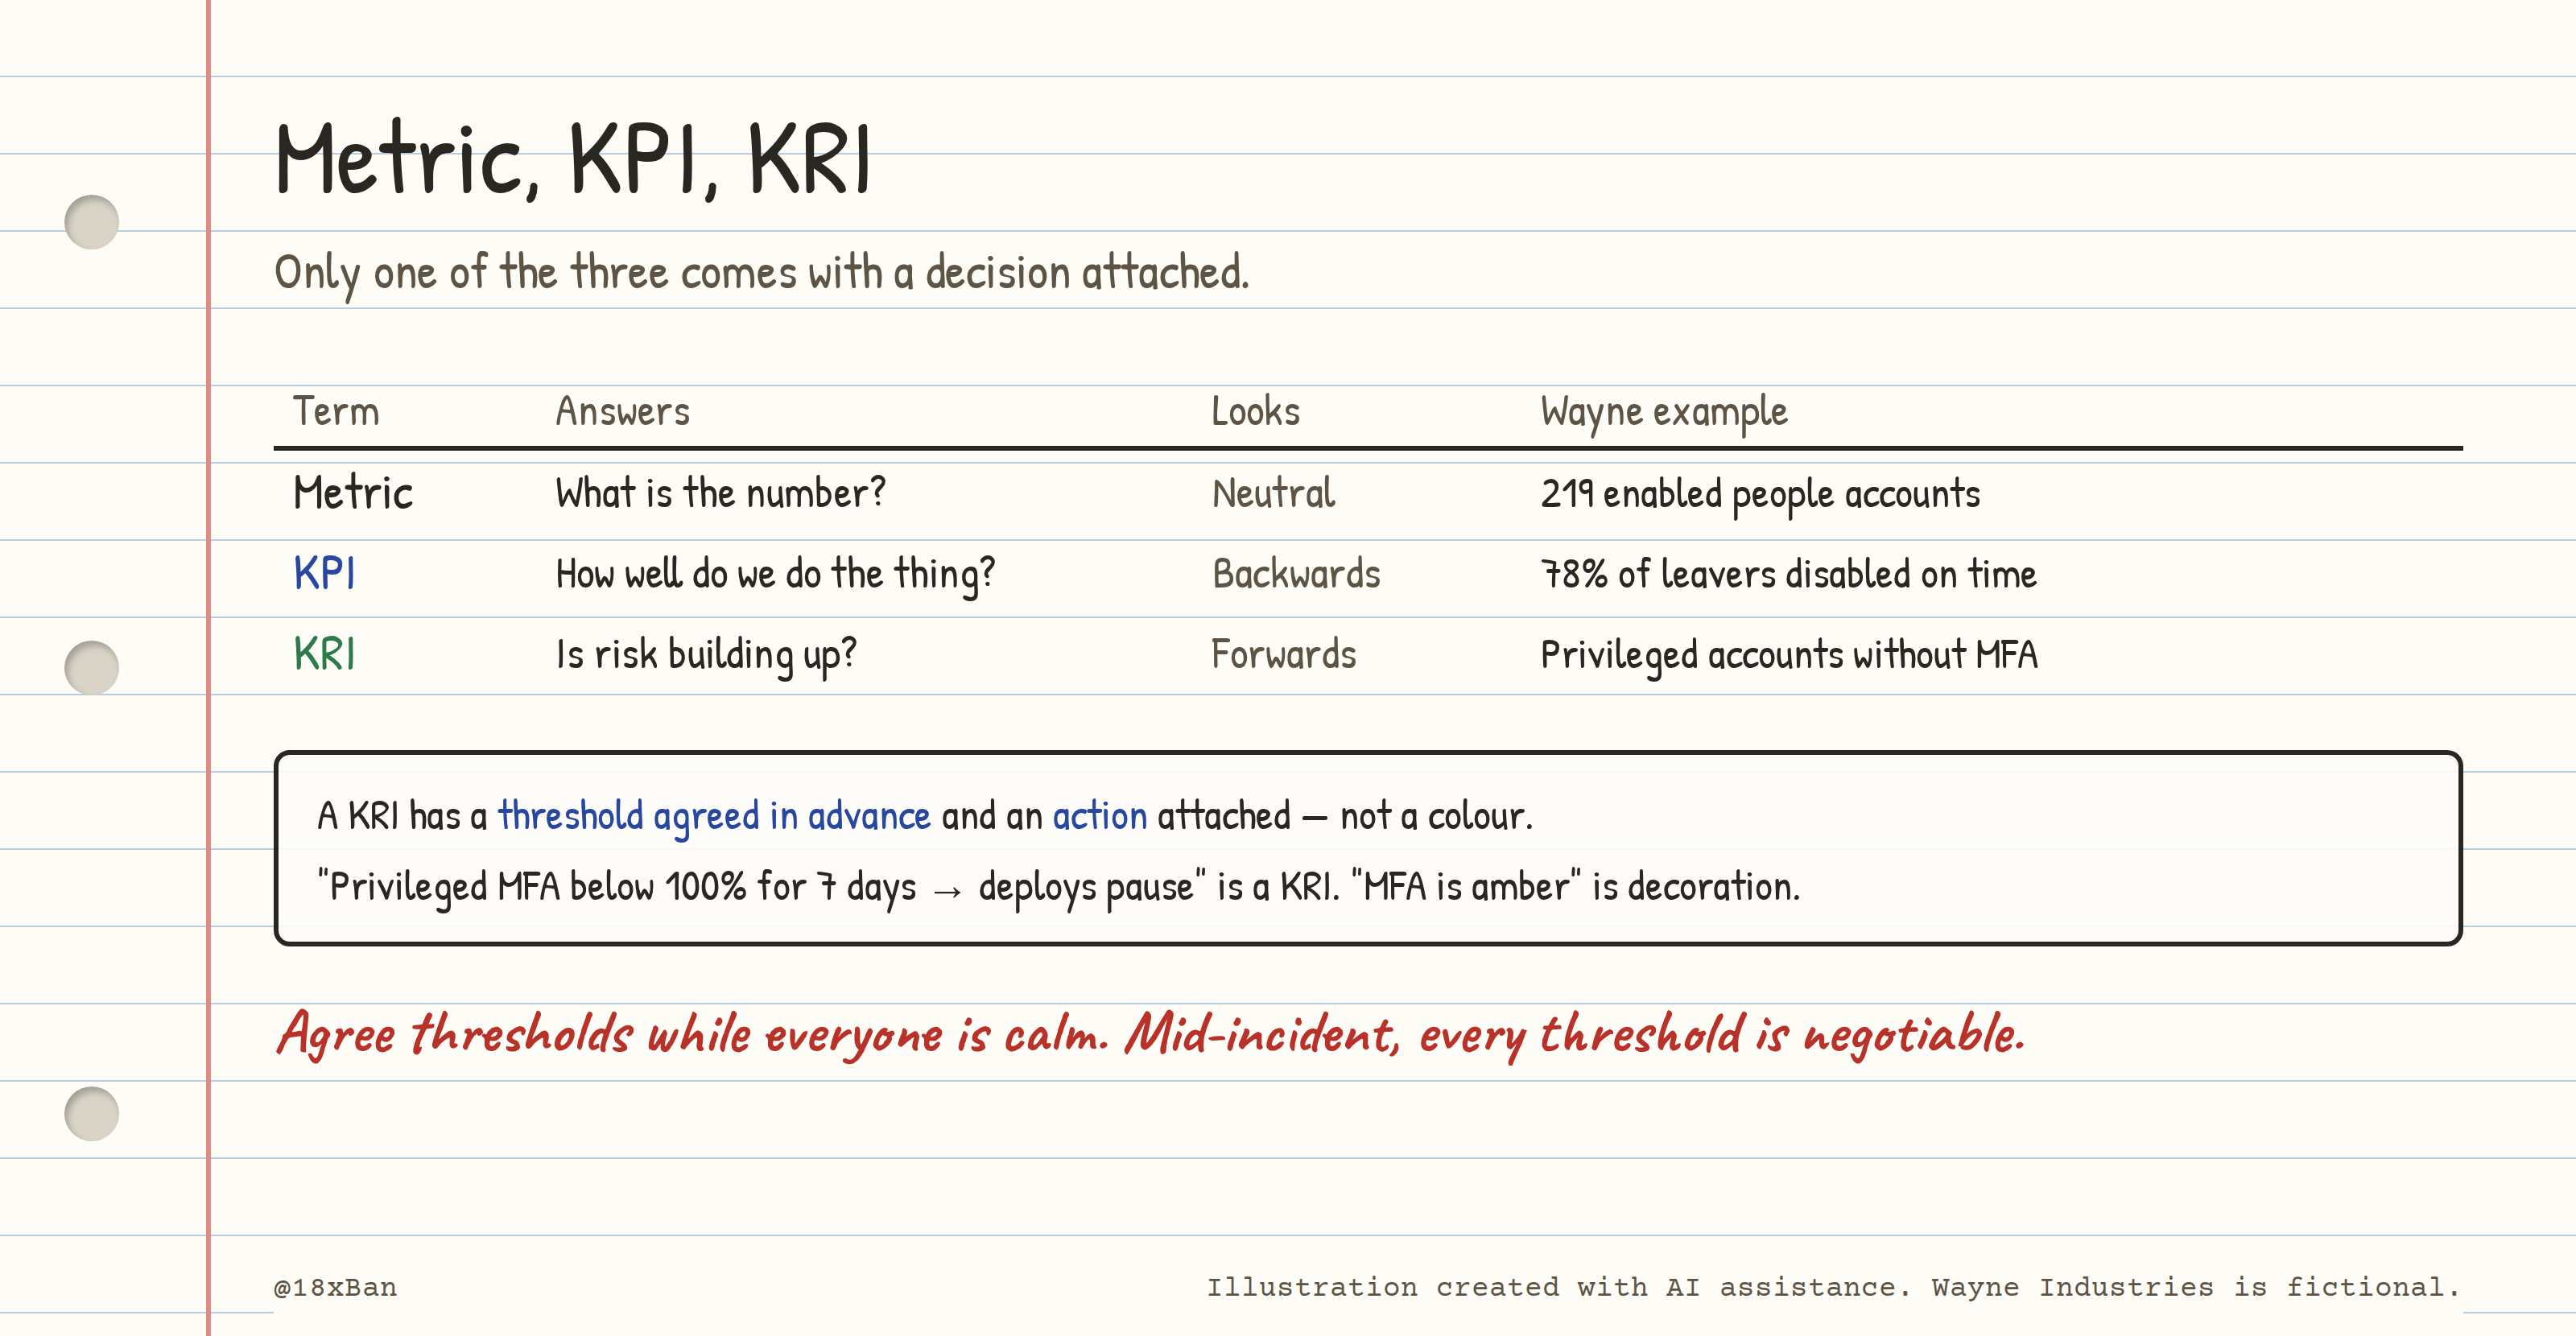
One of these 3 produces a decision. The other 2 produce nods.
The published template: NIST SP 800-55
You don't need to invent a measure format. NIST published the final version of SP 800-55, Measurement Guide for Information Security, in December 2024, in two volumes: Volume 1 on identifying and selecting measures, Volume 2 on running a measurement programme. Both are free.
https://csrc.nist.gov/pubs/sp/800/55/v2/final
The part worth stealing is the discipline of documenting each measure before you report it, so that the number means the same thing next quarter.
Field by field: one measure, specified
| Field | What goes in it | Wayne's MFA example |
|---|---|---|
| Measure ID | A stable identifier | SEC-02 |
| Goal | The objective it supports | Credential theft doesn't become account takeover |
| Measure | The statement in words | Share of people accounts enrolled in MFA |
| Type | Implementation, effectiveness, or impact | Implementation |
| Formula | Numerator ÷ denominator, exactly | MFA-enrolled accounts ÷ enabled non-service accounts |
| Population | What's counted and what's excluded, and why | All enabled AD user accounts except OU=ServiceAccounts |
| Target and threshold | The goal, and the level that triggers action | 95% by 31 March; below 90% at that date triggers escalation |
| Frequency | How often it's produced | Monthly, first working day |
| Responsible party | Who produces it and who owns the outcome | Produced by you; owned by you; reviewed by Dan |
| Data source | Where it comes from, reproducibly | AD export, same query each month |
| Action on breach | What happens automatically if the threshold is crossed | Escalate to Maya with a costed fix |
The last row is Wayne's addition, and it's the one that turns reporting into governance. ISO 27001 Clause 9.1 asks you to determine what's monitored, the methods, when it's done, who does it, and when results are evaluated and by whom and to keep the results as documented information. A measure sheet like this answers all of it on one page.
The unpopular truth: if you can't write the formula and the population down, you don't have a metric. You have a number that will change meaning the first time somebody else runs it which is exactly how a 62% became a 54%.
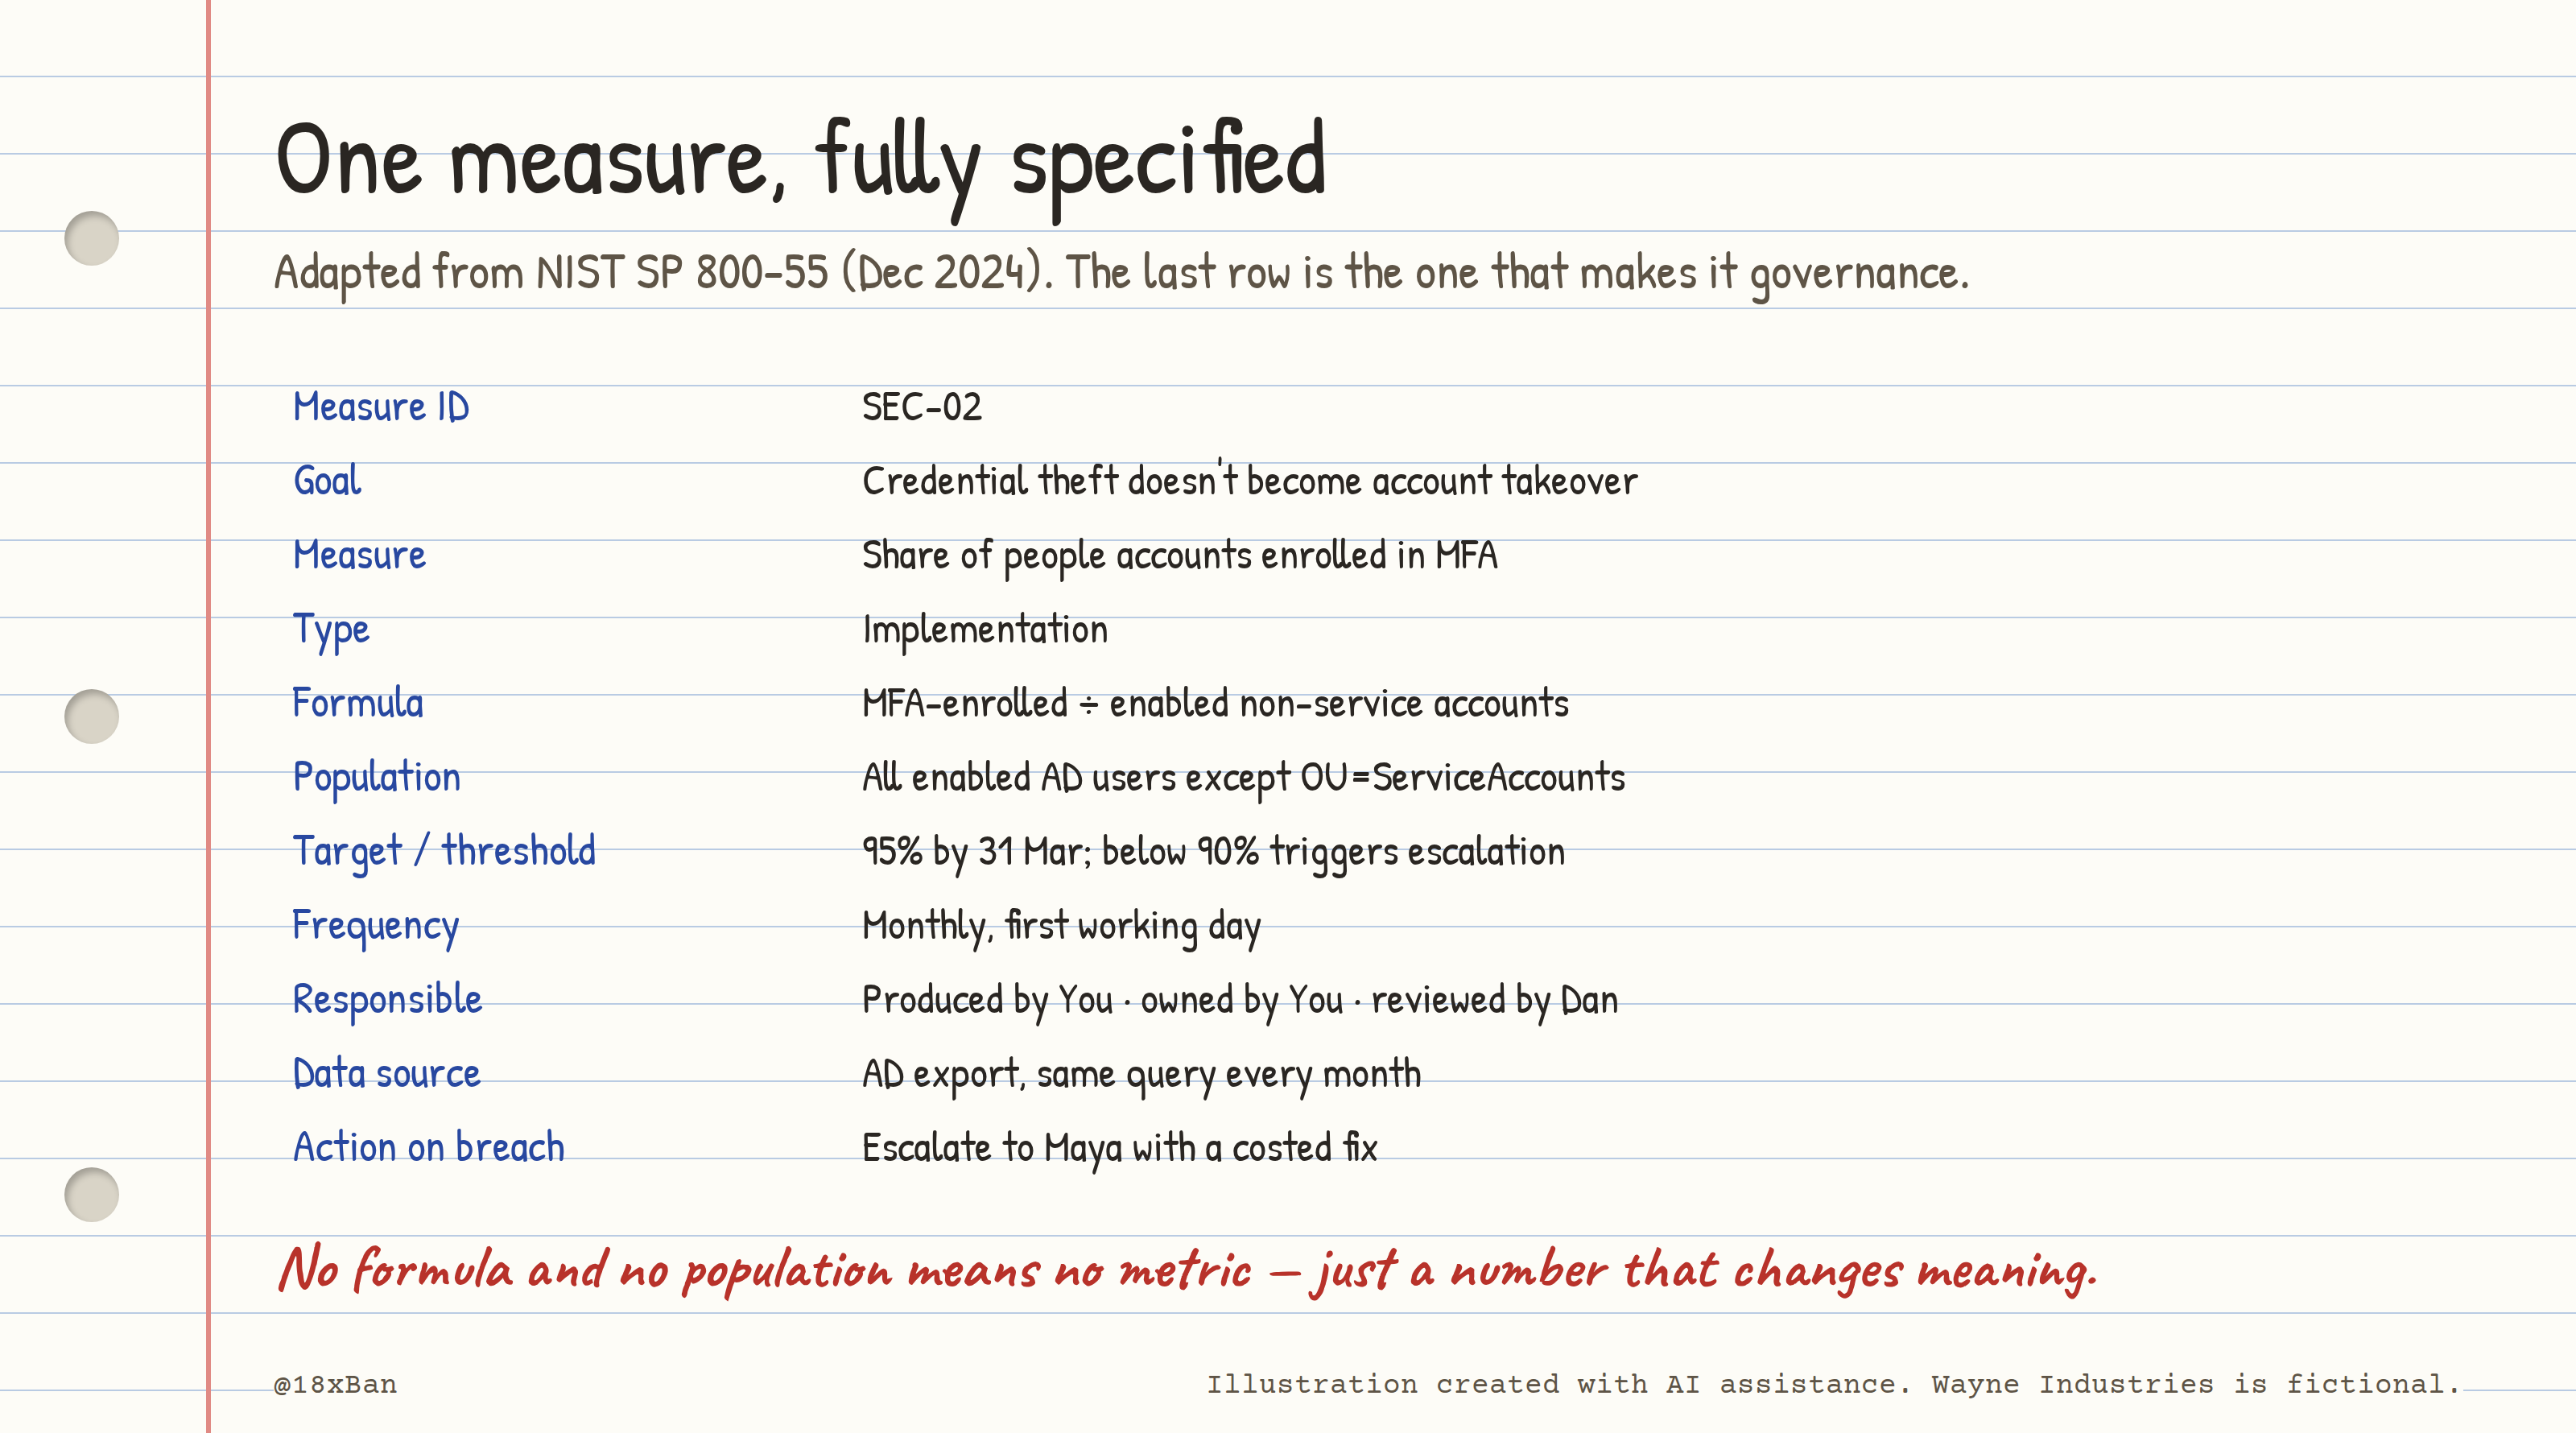
11 fields, so the number means the same thing in March.
Wayne's six
6 is not a magic number, but it fits on one page and in 10 minutes, and an executive can hold 6 things in their head.
| # | What we measure | Now | Trend | Threshold → action | Owner |
|---|---|---|---|---|---|
| 1 | MFA coverage, people accounts | 71% | ▲ from 54% | <90% at 31 Mar → escalate with costed fix | You |
| 2 | Leavers disabled by end of last working day (90 days) | 78% (7 of 9) | ▲ new | Any exception → reported same month; two in a row → change the trigger | Farah |
| 3 | Restore tests passed (rolling 90 days) | 1 of 1, RTO 3h47 vs 4h target | ▲ new | A quarter with no test, or RTO missed → escalate | You |
| 4 | Storage publicly accessible | 0 | ▬ | >0 for more than 24 hours → treated as an incident | Priya |
| 5 | Vendors with a current security review | 0 of 12 | ▬ | Tier-1 vendors still unreviewed at 30 Jun → stop new data sharing | Dan |
| 6 | Critical vulnerabilities older than 30 days | No data | — | Data by 6 Dec, or this becomes a reported risk | You |
Row 6 is the most valuable line on the page. Reporting no data honestly, with a date attached, does two things: it stops anyone assuming the number is fine, and it creates a deadline in front of witnesses.
Note what isn't there: no maturity score, no ticket counts, no log volumes, no attack totals. They're all in your own tracking. None of them would change a decision this month.
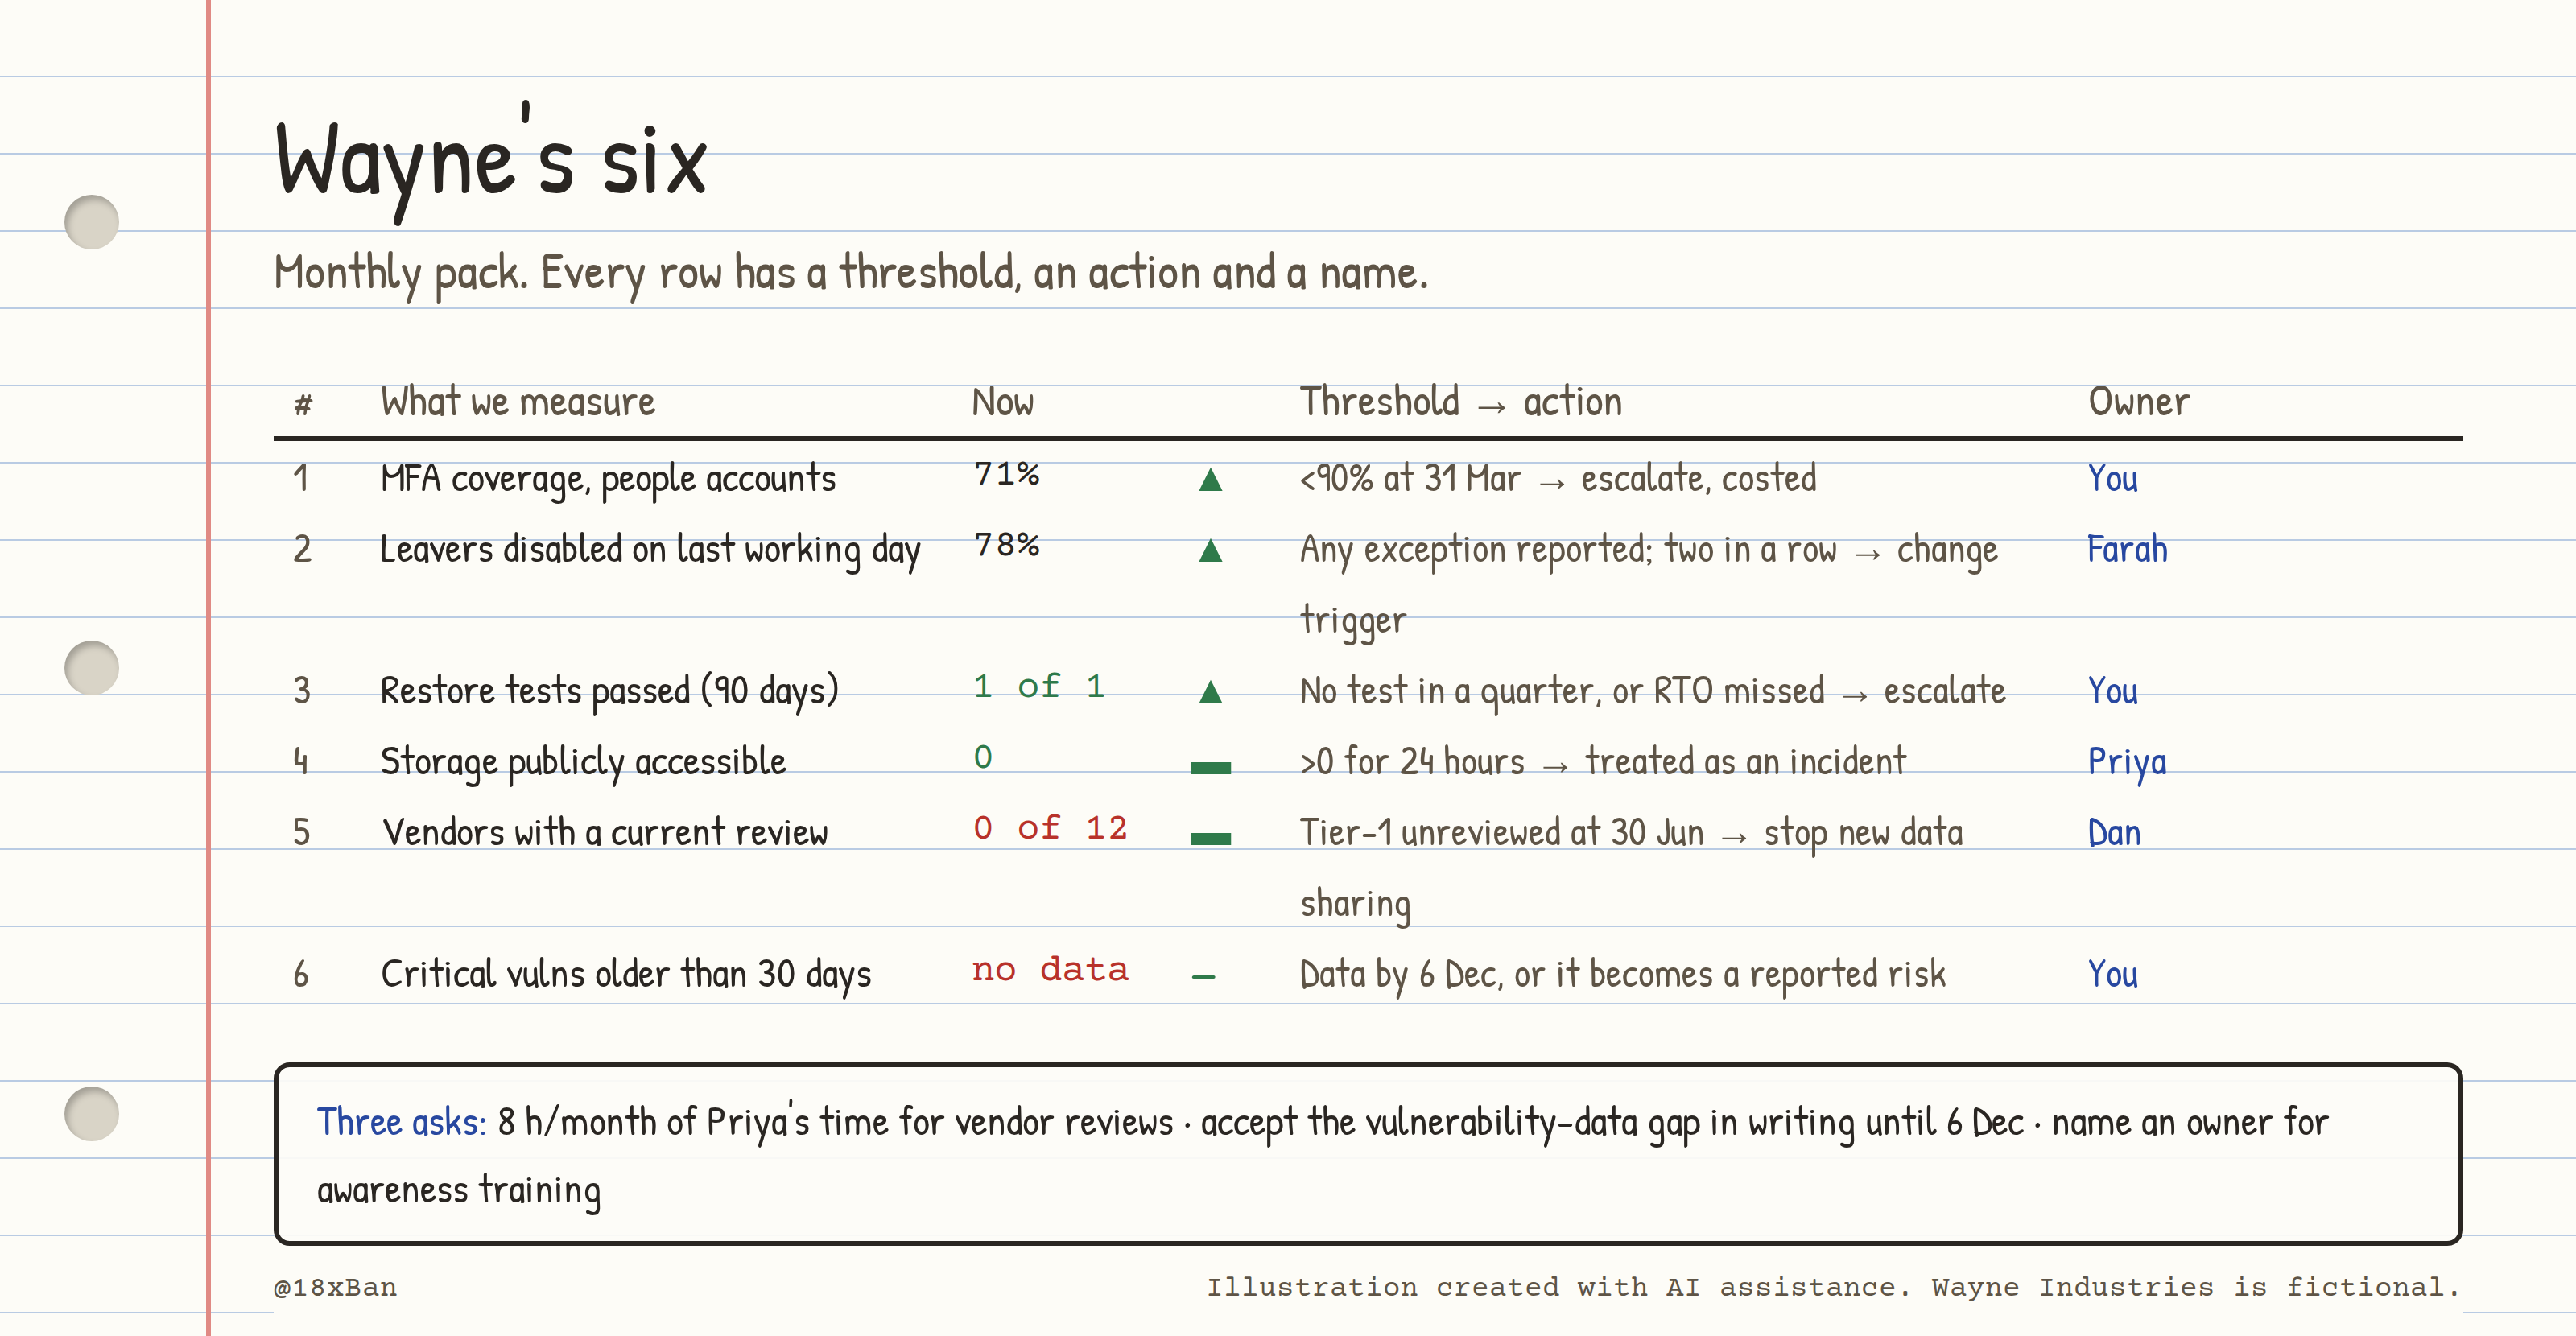
6 rows. Every row has a threshold and a name.
The three asks
A board report that asks for nothing is a status update. Attach at most 3 decisions, each with an option set and a recommendation.
Ask 1 — Vendor reviews. 12 vendors, none reviewed. Options: (a) 8 hours a month of Priya's time from January, (b) defer to Q2 and accept the risk, (c) fund external help. Recommended: (a).
Ask 2 — Vulnerability data. We have no scanning data today. Recommended: accept this risk in writing until 6 December, when the first scan is due.
Ask 3 — Security awareness. No owner. Options: Farah takes it with 2 hours a month, or it's deferred to Q2 with that stated. Recommended: Farah, starting February.
Each ask has a recommendation, because "here are 3 options, you decide" pushes your job onto the person with the least context.
Building the pack without building a dashboard
The pack is a script and a table, not a BI tool. Wayne's version pulls 3exports and prints the page.
# board-pack.py — six measures, thresholds evaluated, one table out
import csv

def pct(n, d):
    return None if not d else round(100 * n / d)

with open("ad-export.csv") as f:
    users = [r for r in csv.DictReader(f)
             if r["enabled"] == "TRUE" and "ServiceAccounts" not in r["dn"]]
mfa = pct(sum(r["mfa"] == "TRUE" for r in users), len(users))

with open("leavers-90d.csv") as f:
    leavers = list(csv.DictReader(f))
ontime = pct(sum(r["on_time"] == "TRUE" for r in leavers), len(leavers))

measures = [
    ("SEC-02 MFA coverage",        f"{mfa}%",                mfa is not None and mfa < 90),
    ("SEC-03 Leavers on time",     f"{ontime}%",             ontime != 100),
    ("SEC-04 Restore tests (90d)", "1 of 1, RTO 3h47",       False),
    ("SEC-05 Public storage",      "0",                      False),
    ("SEC-06 Vendors reviewed",    f"0 of {12}",             True),
    ("SEC-07 Critical vulns >30d", "no data (due 6 Dec)",    True),
]

for name, value, breached in measures:
    print(f"{name:<30} {value:<22} {'ACTION' if breached else 'ok'}")
SEC-02 MFA coverage            71%                    ACTION
SEC-03 Leavers on time         78%                    ACTION
SEC-04 Restore tests (90d)     1 of 1, RTO 3h47       ok
SEC-05 Public storage          0                      ok
SEC-06 Vendors reviewed        0 of 12                ACTION
SEC-07 Critical vulns >30d     no data (due 6 Dec)    ACTION
Sample output (illustrative). Wayne Industries is fictional.
Same query, same population, same month-end cut. That reproducibility is what makes a trend line meaningful, and it's also what an auditor tests when they ask how the number was produced.
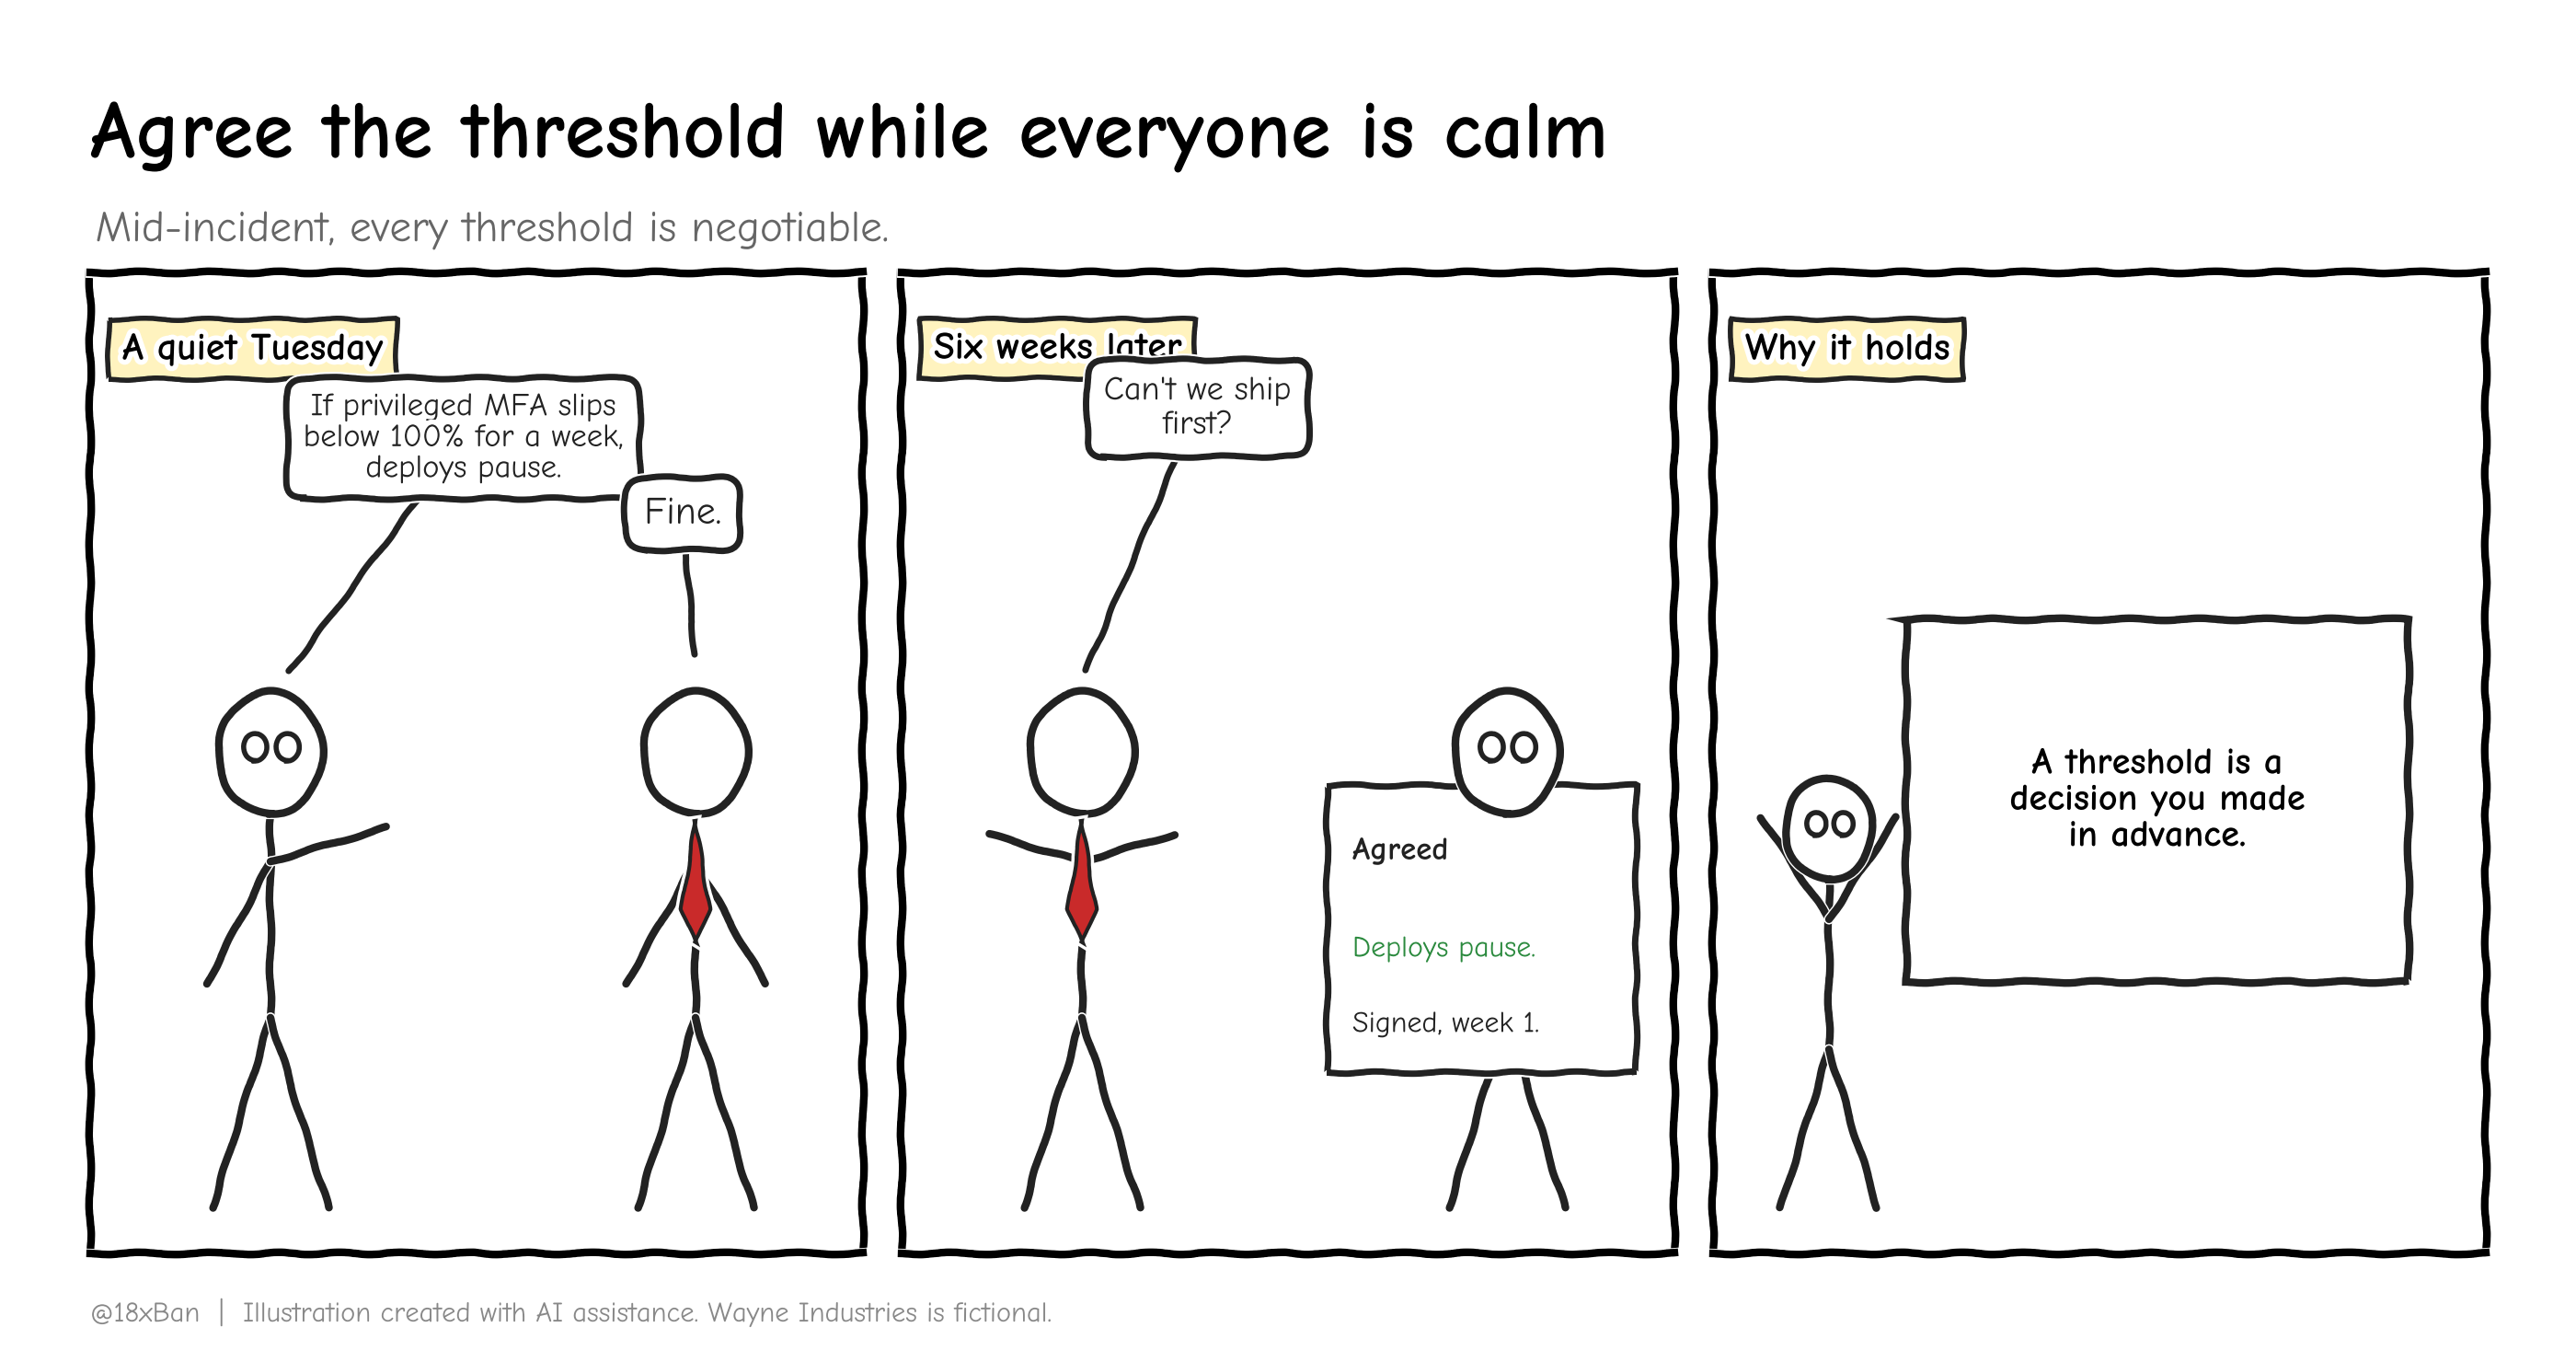
Agree the threshold while nobody's shouting.
Thursday, 4 weeks later: 9 minutes
The second meeting goes differently.
One page on screen. 6 rows. You spend most of the time on rows 5 and 6, because they're the ones with asks attached.
Maya approves Priya's 8 hours a month. Dan accepts the vulnerability-data gap in writing, until 6 December. Farah takes security awareness from February, with 2 hours a month.
9 minutes, 3 decisions, all of them recorded in the minutes with names and dates.
Then Maya asks for something you didn't expect: "Can I see this every month, the same shape, even when nothing's changed?" That's the whole game. A report someone asks for again is a governance loop.
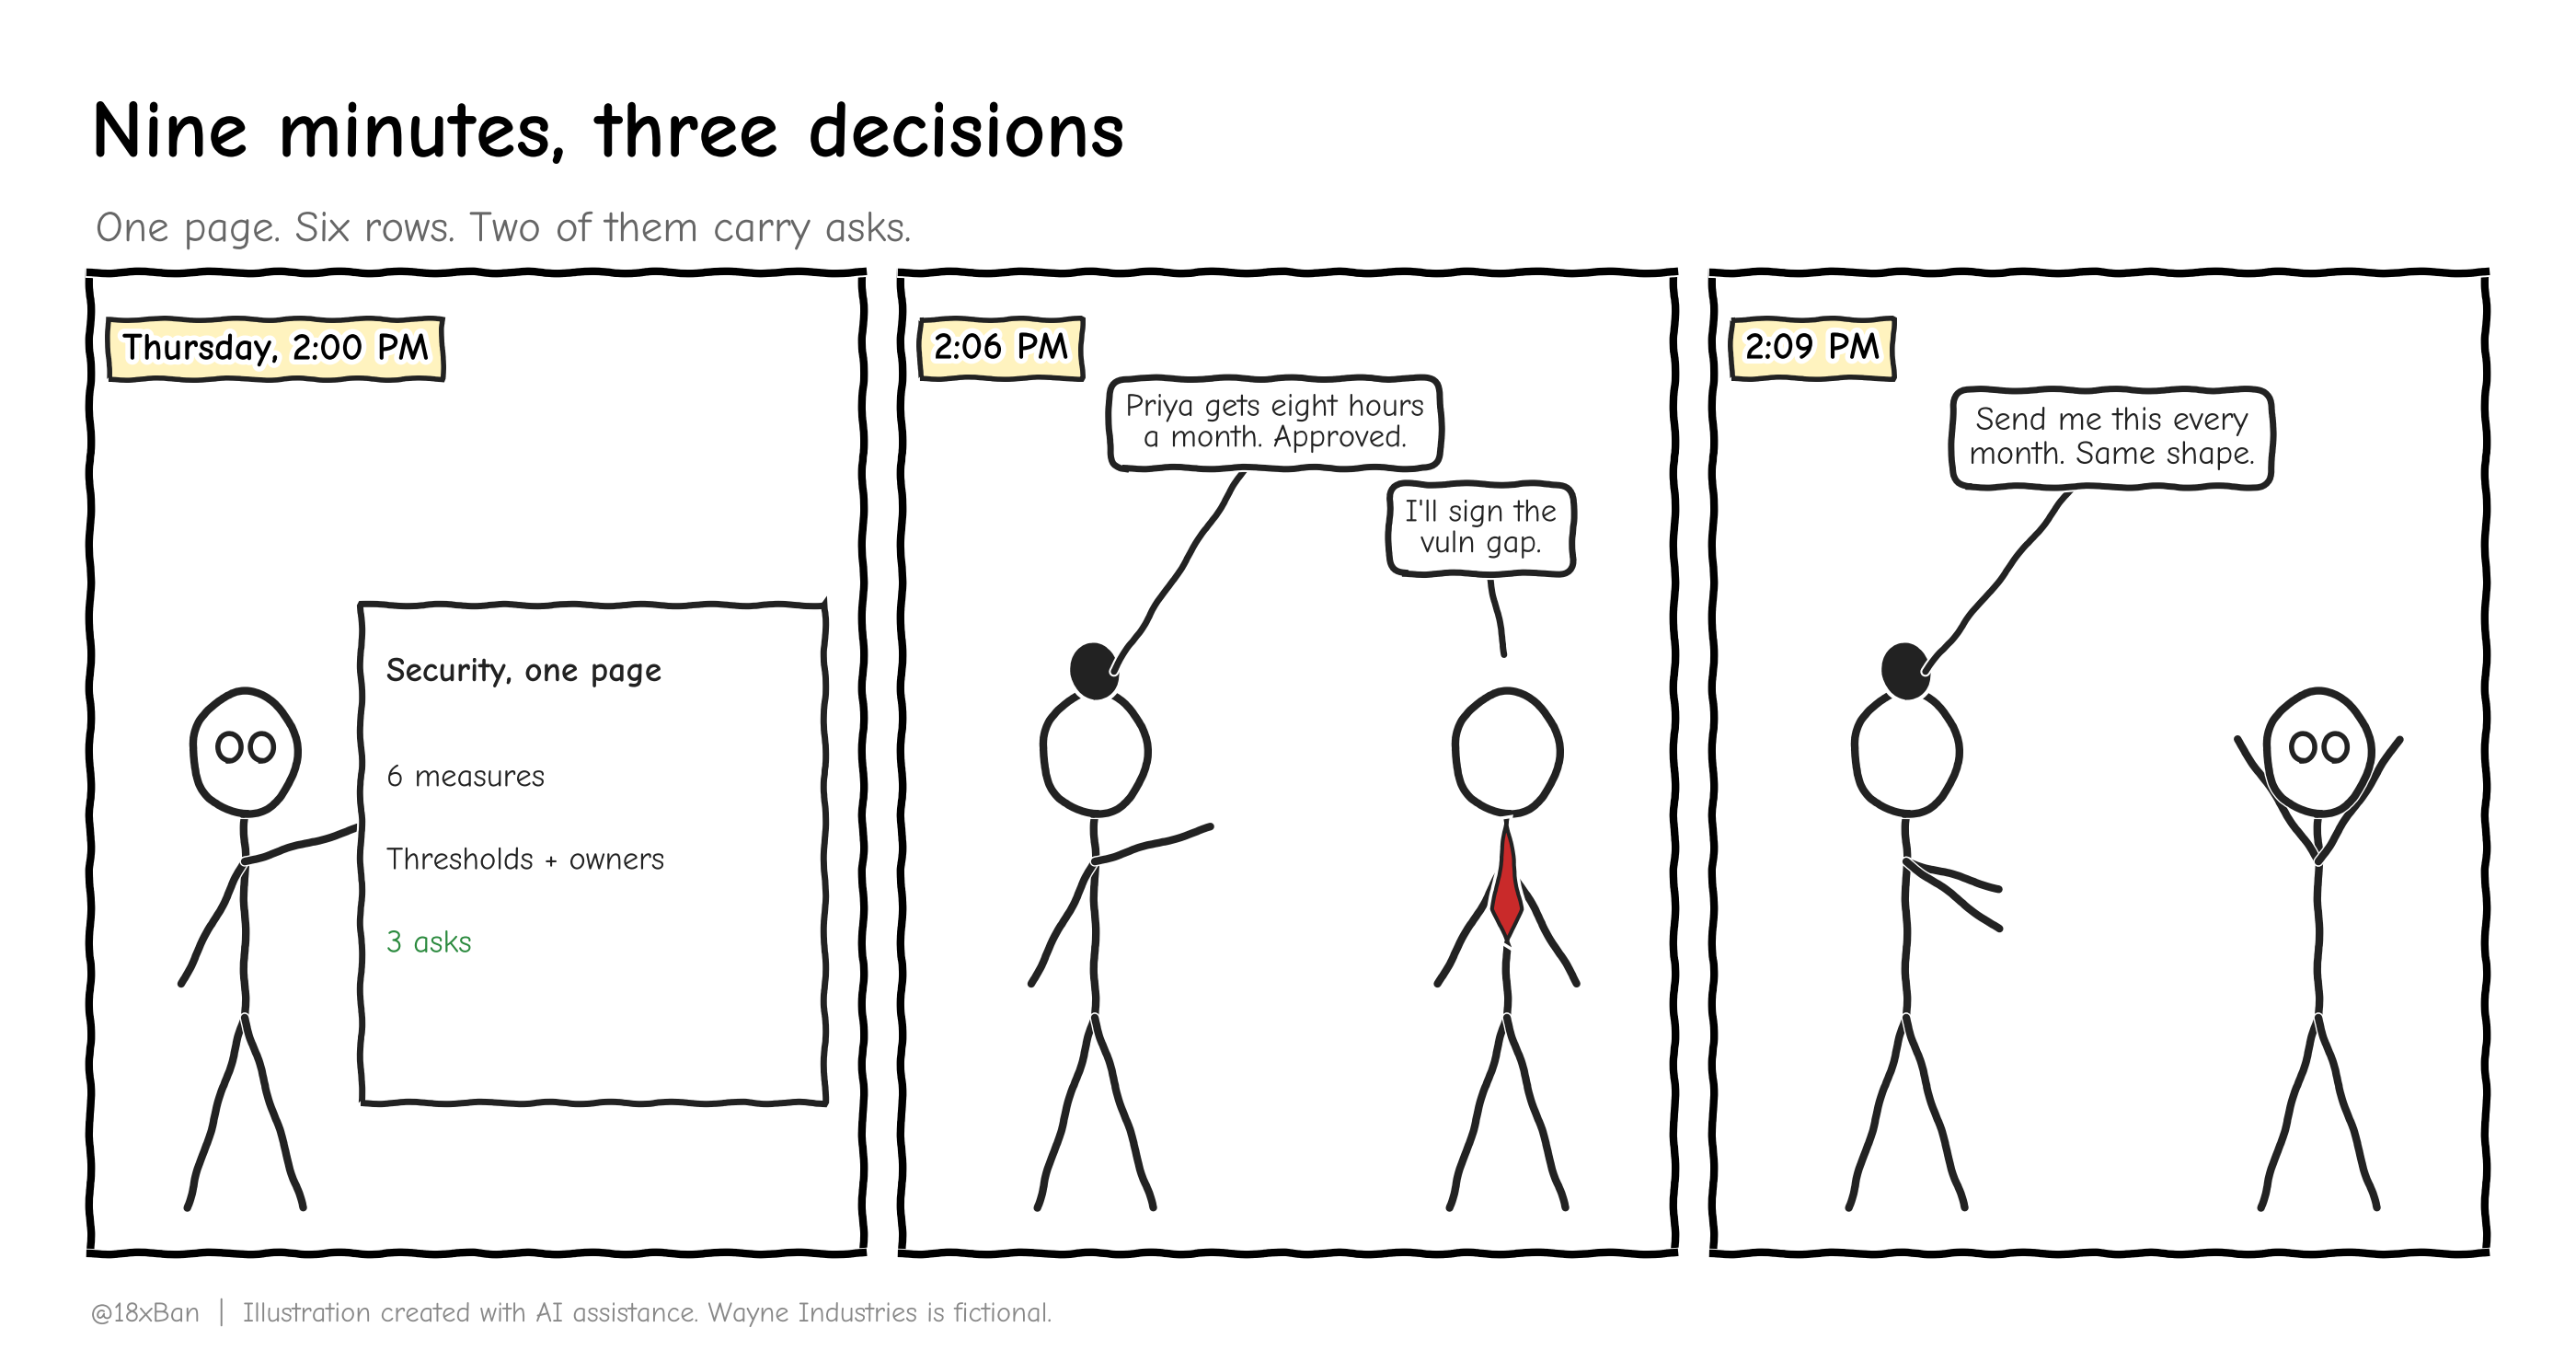
3 decisions, names attached, in the minutes.
Evidence #12
The measure specification sheet: 6 measures, formulas, populations, thresholds and owners.
The monthly pack, with the date it was produced and the query used.
The minutes: 3 decisions, who made each one, and the dates attached.
Dan's written acceptance of the vulnerability-data gap, with an expiry date of 6 December.
The standing calendar entry: security on the leadership agenda, monthly.
Evidence #12: monitoring results that were reviewed by leadership and produced recorded decisions.
That sentence is close to word-for-word what ISO 27001 Clause 9.1 and Clause 9.3 want, and what SOC 2 expects when it asks that deficiencies be communicated to the people who can act on them.
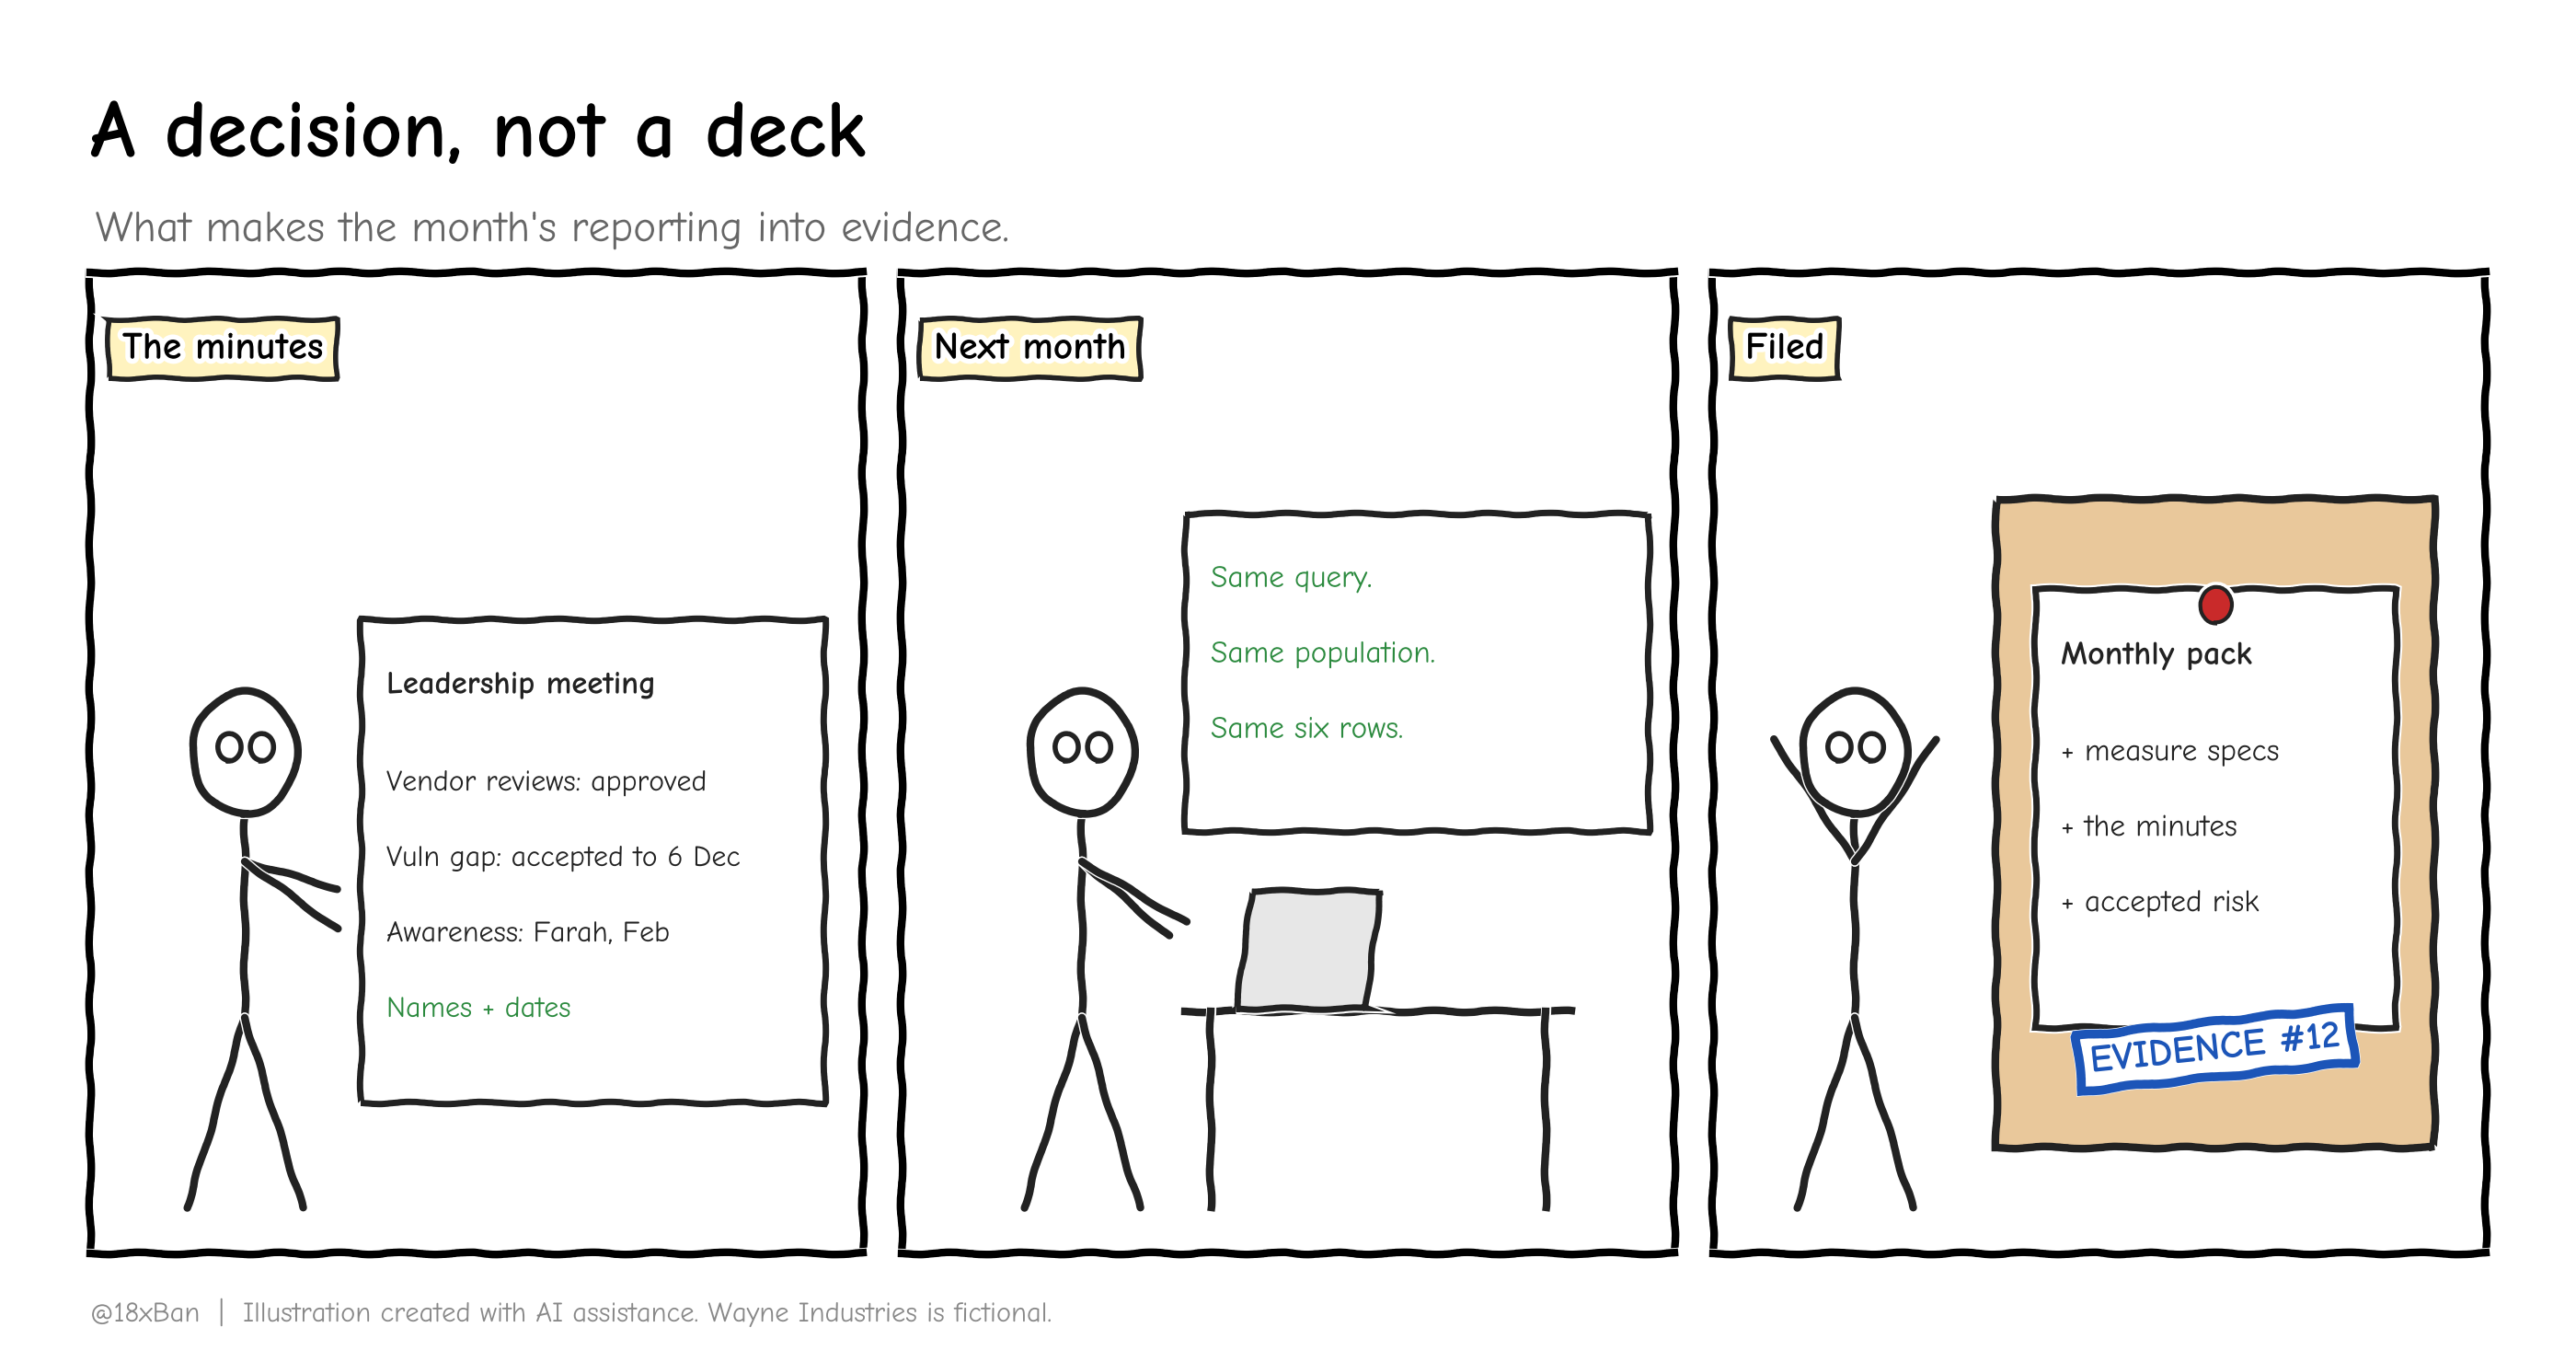
A number nobody acts on is a note. A number with a decision attached is governance.
What an auditor accepts vs rejects
| Accepted | Rejected |
|---|---|
| A defined measure with formula and population | A percentage with no denominator |
| The same query, month after month | A number rebuilt by hand each time |
| Thresholds agreed before the breach | Colour-coded status with no agreed action |
| Minutes showing decisions, with names and dates | A deck that was presented and then filed |
| An honest "no data" with a due date | A blank row, or a guess |
| A risk accepted in writing, with an expiry | "Leadership is aware" |
What you actually do on Monday
Delete half your charts. Keep only what changes a decision.
Write the formula and the population for every number you plan to report.
Pick 6. 5 to 7 is the range that survives a 10-minute slot.
Set a threshold and an action for each, and get them agreed while things are calm.
Report your gaps as rows, with dates, not as omissions.
Attach 3 asks, each with options and a recommendation.
Ask for the meeting to recur, same shape, every month.
Framework mapping
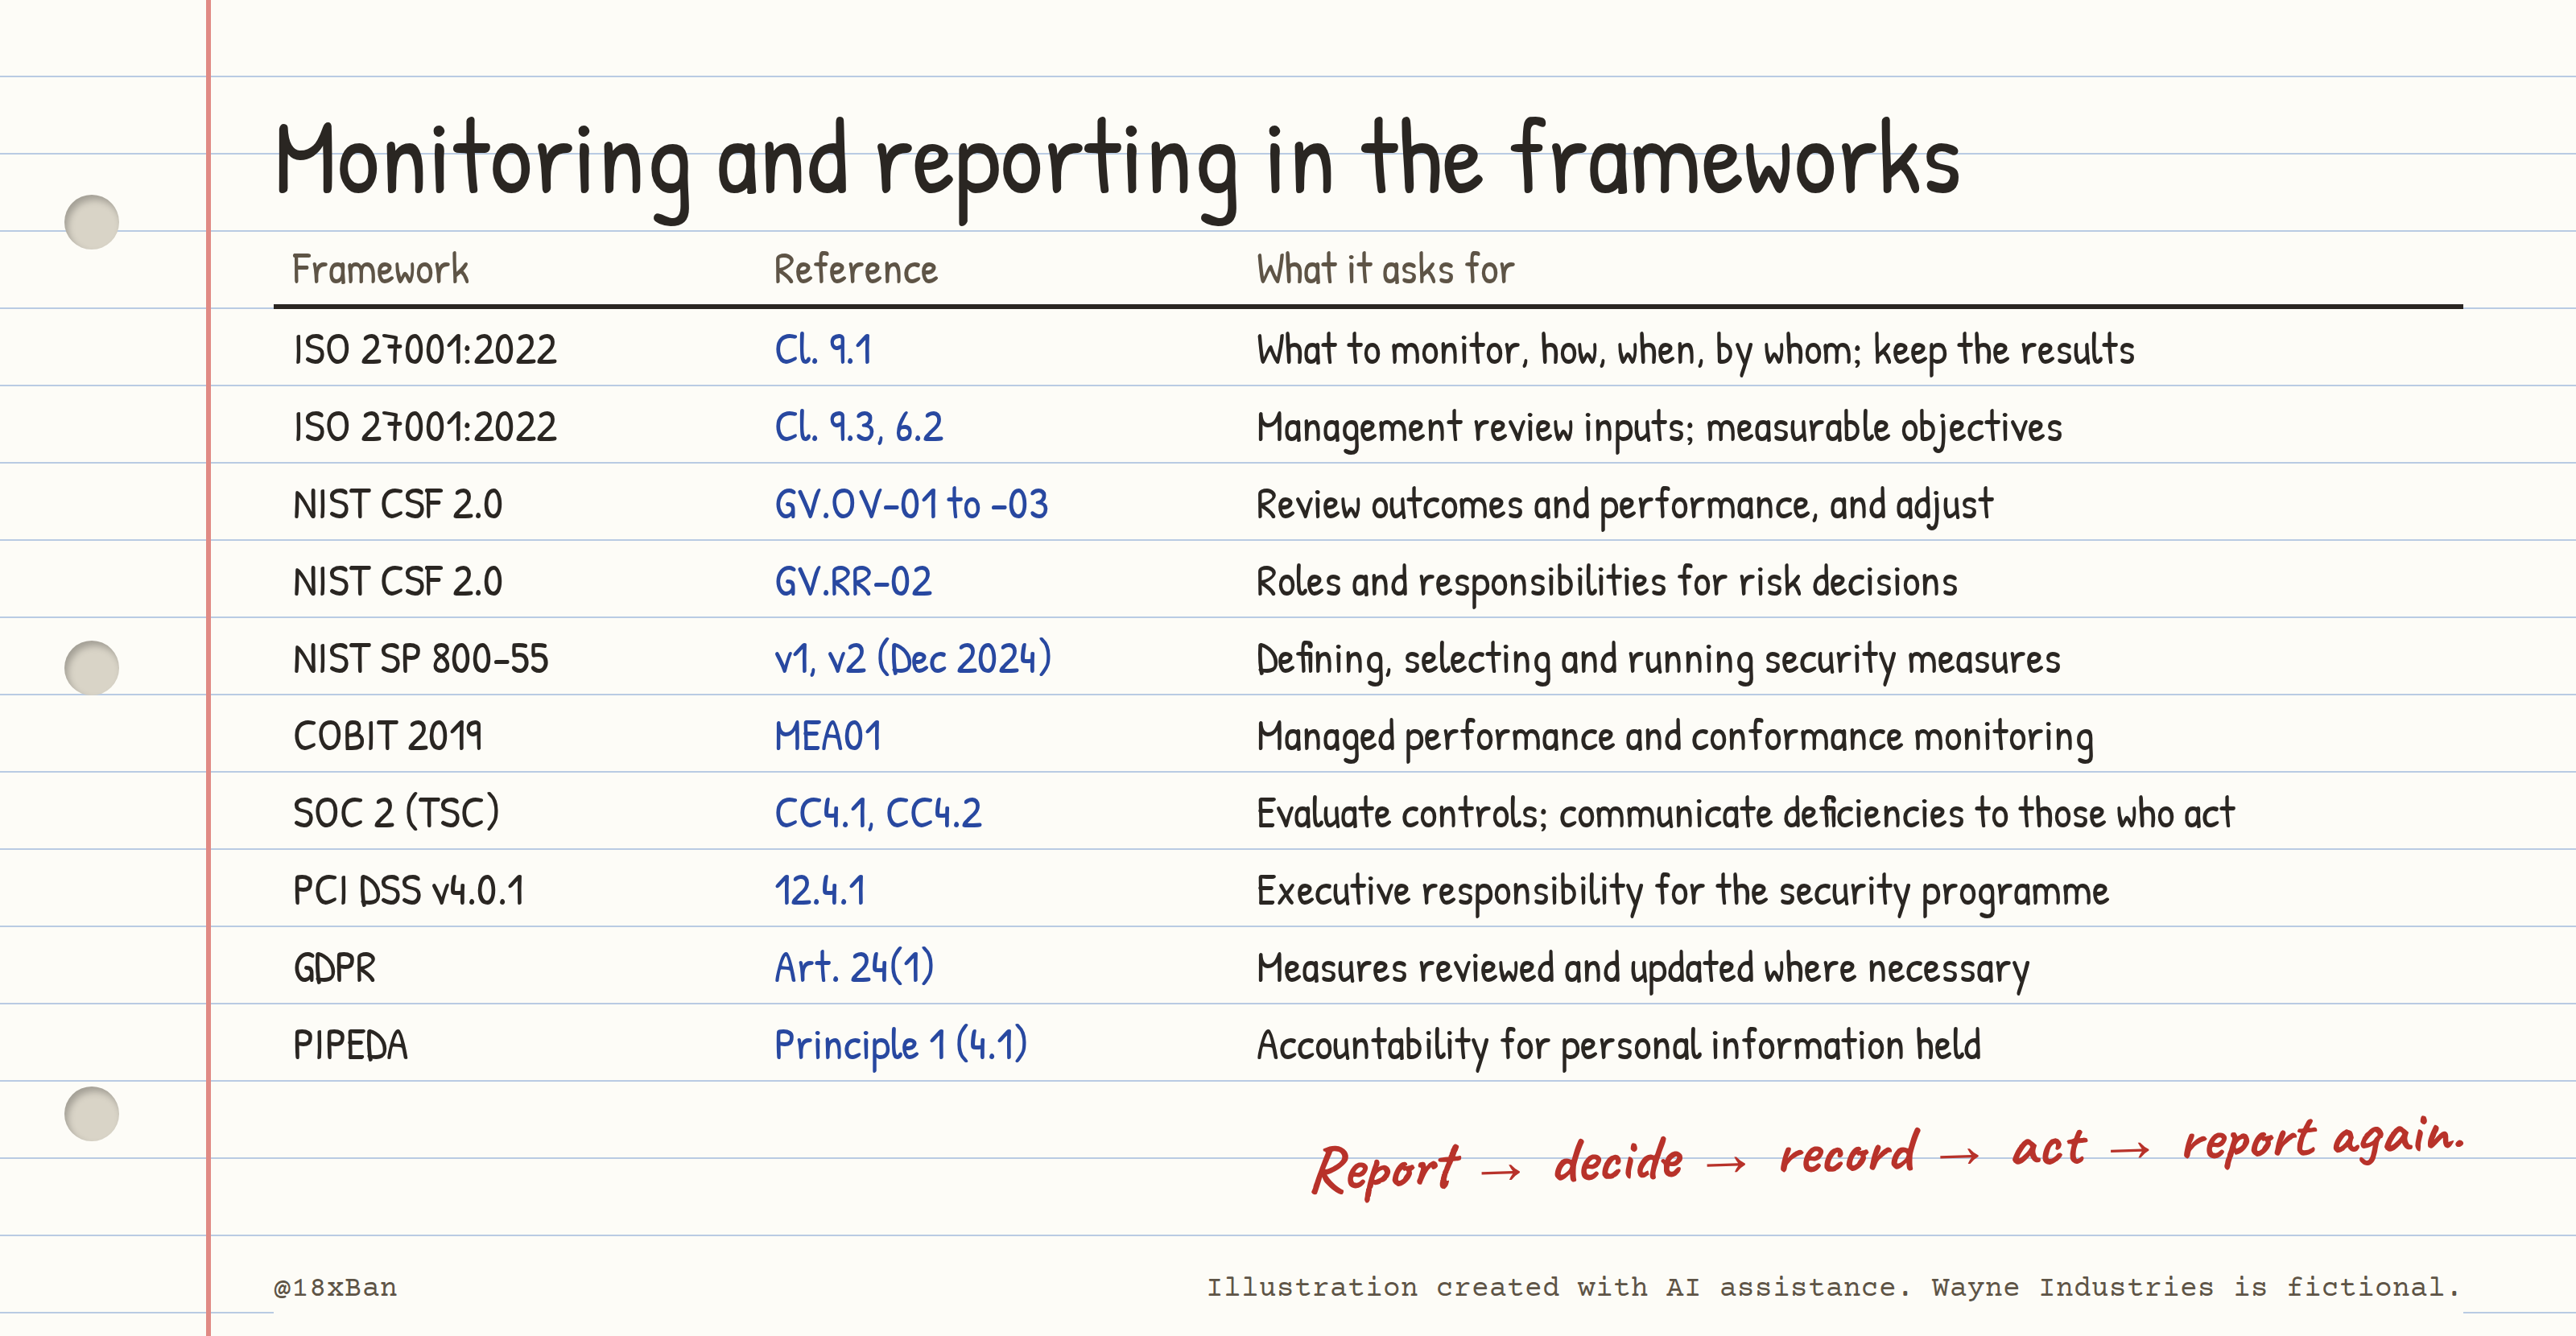
Monitoring, reporting, deciding: the same loop in every framework.
Maturity ladder
| Stage | 20 people | 200 people | 2,000 people |
|---|---|---|---|
| What's reported | One page, 6 numbers | One page + a risk annex | Tiered reporting: exec page, committee pack |
| Where numbers come from | A script and 3 exports | Scheduled jobs writing to one store | Integrated tooling with lineage |
| Thresholds | Agreed verbally, written in the pack | Documented per measure, reviewed annually | Tied to risk appetite statements |
| Decisions | 3 asks in the minutes | Standing agenda item with an action log | Board committee with tracked resolutions |
| The trap | Reporting activity instead of risk | Growing the pack until nobody reads it | Optimising metrics instead of risk |
At 20 people, the pack is a page and a calendar invite. That's not a lesser version of governance; it's the same loop with fewer people in the room.
Where Wayne sits: 6 measures, thresholds agreed, 3 decisions recorded, and a standing monthly slot. The gap is that nobody yet re-performs the numbers before they go out, other than Priya on MFA.
Cheatsheet
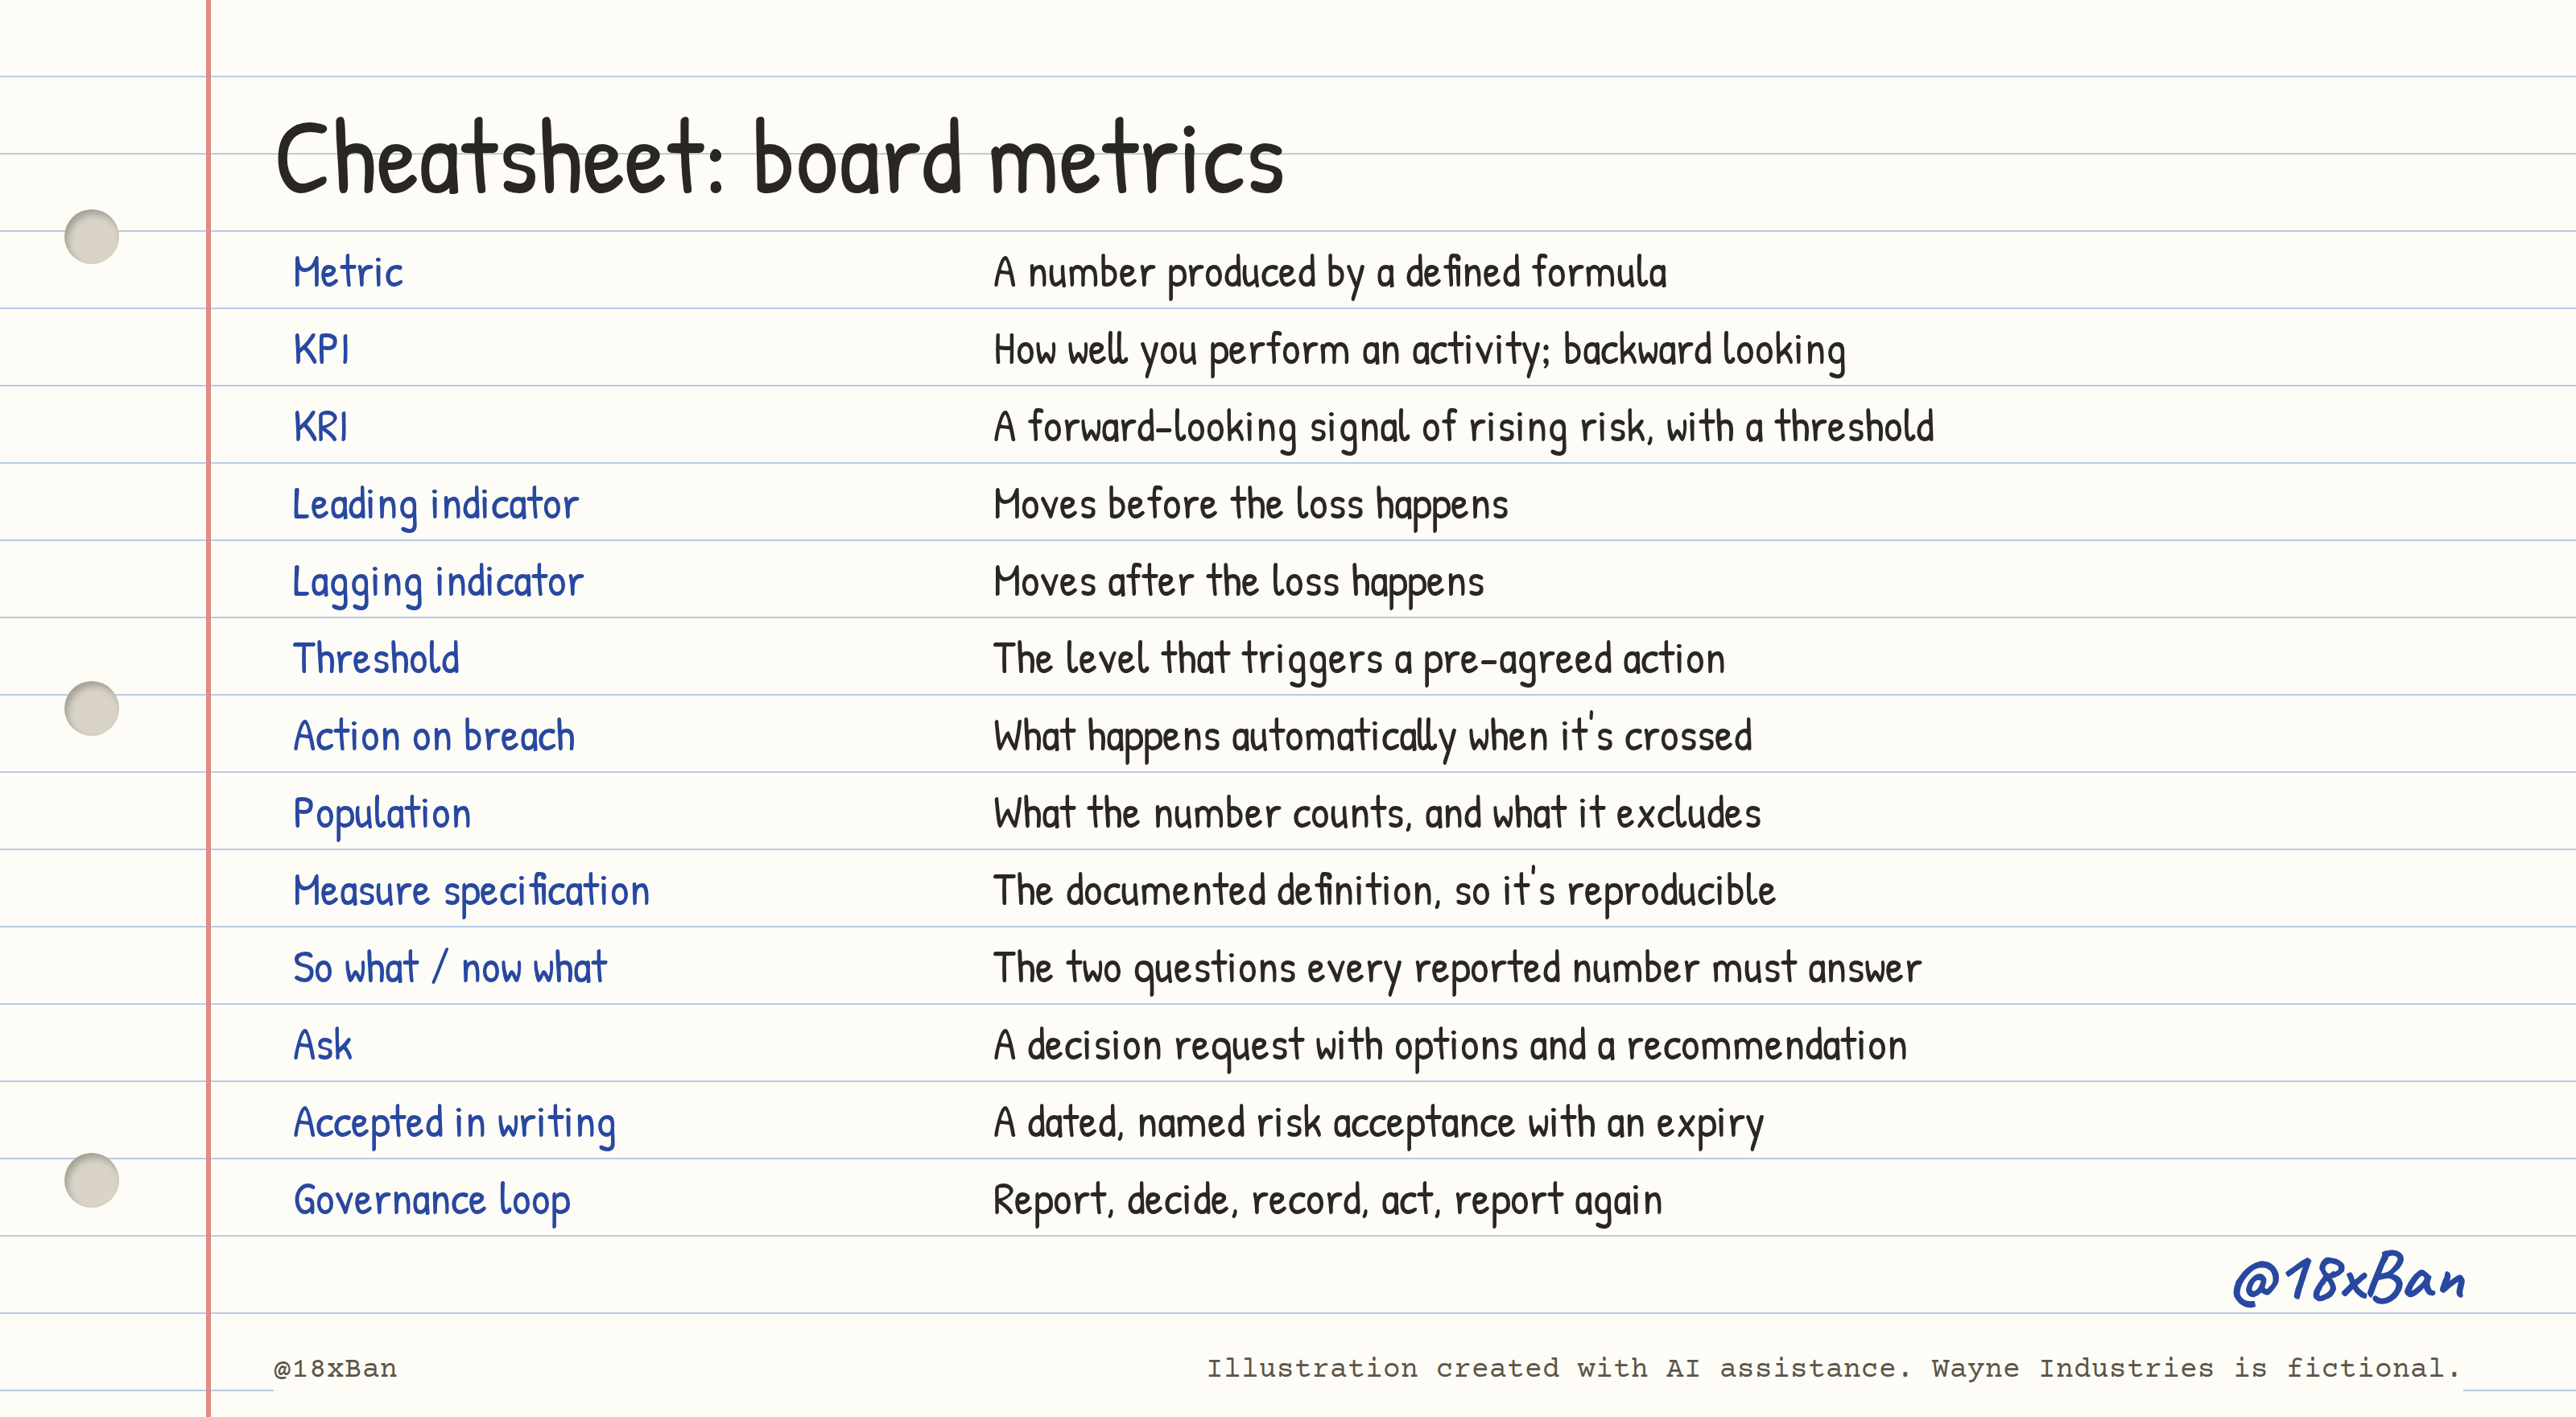
Board metrics, on one page.
The takeaway
If a number wouldn't change a decision, it doesn't belong in the pack. Write the formula and the population, or the number will change meaning behind your back. Agree thresholds and the action they trigger while everyone is calm. Report your gaps as rows with dates. "No data" is a finding you control; a blank row is one you don't.
⚠️ This content is for educational purposes only. Wayne Industries is a fictional company. Nothing here is legal, audit, or compliance advice validate against your own auditor and jurisdiction.